Various parameters exist which allow the Geoscientist to perturb how the operator is generated. In this application these changes occur in real time so you will be able to see immediately the effect of the change you have made. Pop up the "Design Controls" dialog by either clicking the menu item under the menu bar or by clicking the  icon.
icon.
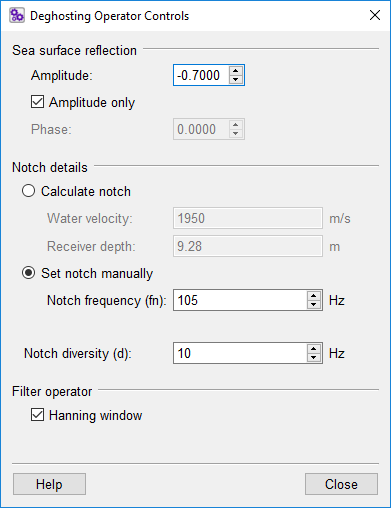
The figure above shows the Design Controls dialog. This dialog allows the various parameters that control the operator to be varied.
To stabilise the deghosting operator, two sea surface reflectivity reflectivity parameters can be specified. One associated with the phase of the sea surface reflection, and the other the amplitude of the sea surface reflection. These can be adjusted to apply some damping and to avoid over-boosting signal and noise at the notch frequency.
The steps below give you a brief overview of the parameters found on the Design Controls dialog
Amplitude: The sea surface amplitude reflectivity coefficient. Controls the strength of the amplitude correction. Values should normally be in the range of -0.5 to -0.9
Phase: The sea surface phase reflectivity coefficient. This controls the strength of the phase correction. This defaults to -1 and normally should not be changed.
When using the phase de-ghosting option, the SGS requires the starting data to be minimum phase. In this mode the SGS deghosting operator will try to remove the effect of the ghost from the phase spectrum of the input data as well as the amplitude spectrum.
The input data for this mode should be in the minimum phase domain, i.e. ghost reflections should be delayed in time from primary reflections. Therefore in this case any zero phasing that has been applied to the input dataset should be removed before SGS is run. Typically this zero-phasing will then need to rerun outside of this plug-in after the application of SGS for this mode. In other words, the data needs to be put back from minimum phase to zero phase before further use.
NOTE: If the Amplitude only checkbox is selected, the value of phase will not be used and will be defaulted to 0.
Calculate notch
Clicking this option will enable the calculation of the Notch frequency from the Water velocity and Z which is either the source or receiver array depth depending on whether you intend to apply source or receiver deghosting.
Water Velocity: The velocity of seawater at the survey location.
Z: The depth of the source or receiver array.
Set notch manually
Clicking this option will allow you to enter the Notch frequency directly.
Notch frequency (fn): The frequency in Hz of the ghost to be suppressed. Can be either a source or receiver ghost depending on whether you intend to apply source or receiver deghosting.
Notch diversity (d): This controls the expected frequency spread in Hz from the notch frequency above.
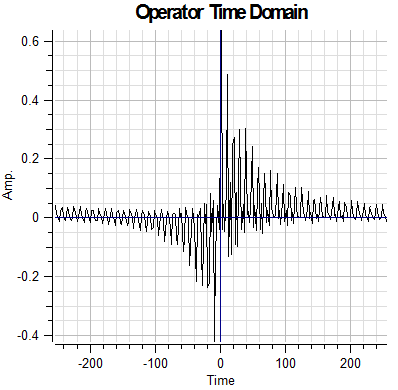
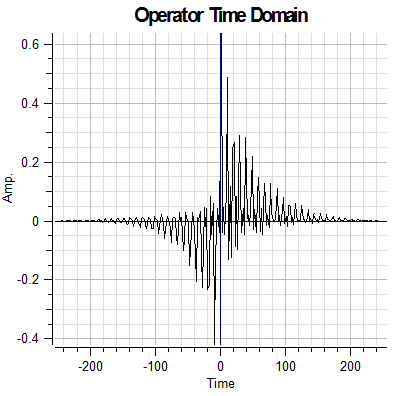
Hanning window: This can optionally be used apply a Hanning window over the the operator. If the operator doesn't have start or end values of zero, then an element of ringiness may appear in the output data. A Hanning window can be applied at the over the operator to bring the end values to zero and reduce ringiness. By default the Hanning window is set on.
The following diagrams show an operator with and without a Hanning window applied.
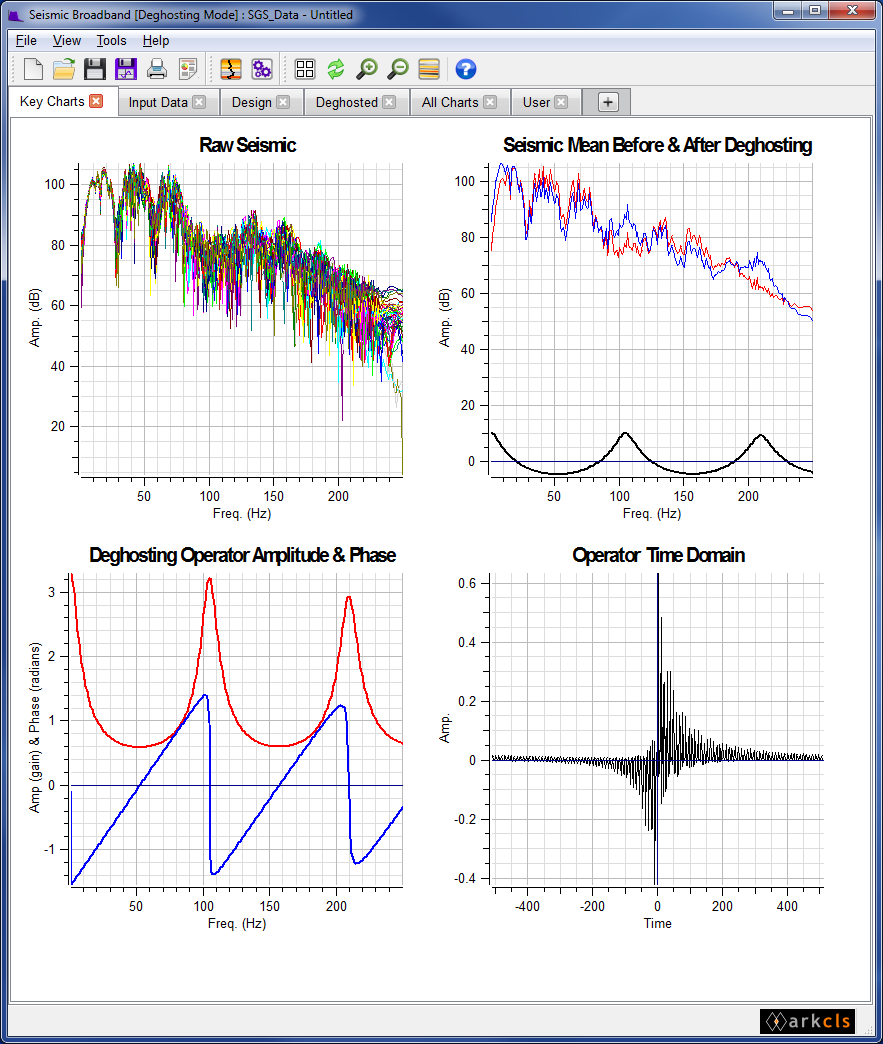
The figure above shows a typical Seismic Broadband main window with the Seismic charts tab selected. The following gives a brief description of each of the charts displayed on each tab using the supplied default template (moving left to right and top to bottom)
Raw Seismic
This chart displays the spectra for each of the set of seismic traces used for the analysis and design of the deghosting operator.
Seismic Mean Before and After Deghosting
This chart displays the mean spectrum of all the raw spectra before (red) and after (blue) the deghosting operator has been applied. The difference between the Before and After is displayed in black. This is essentially the deghosting operator in the frequency domain.
Deghosting Operator Amplitude and Phase
Displays the amplitude of the deghosting operator (red) in the frequency domain along with the phase angle of the operator (blue) in radians.
Operator Time Domain
Displays the deghosting operator in the time domain.
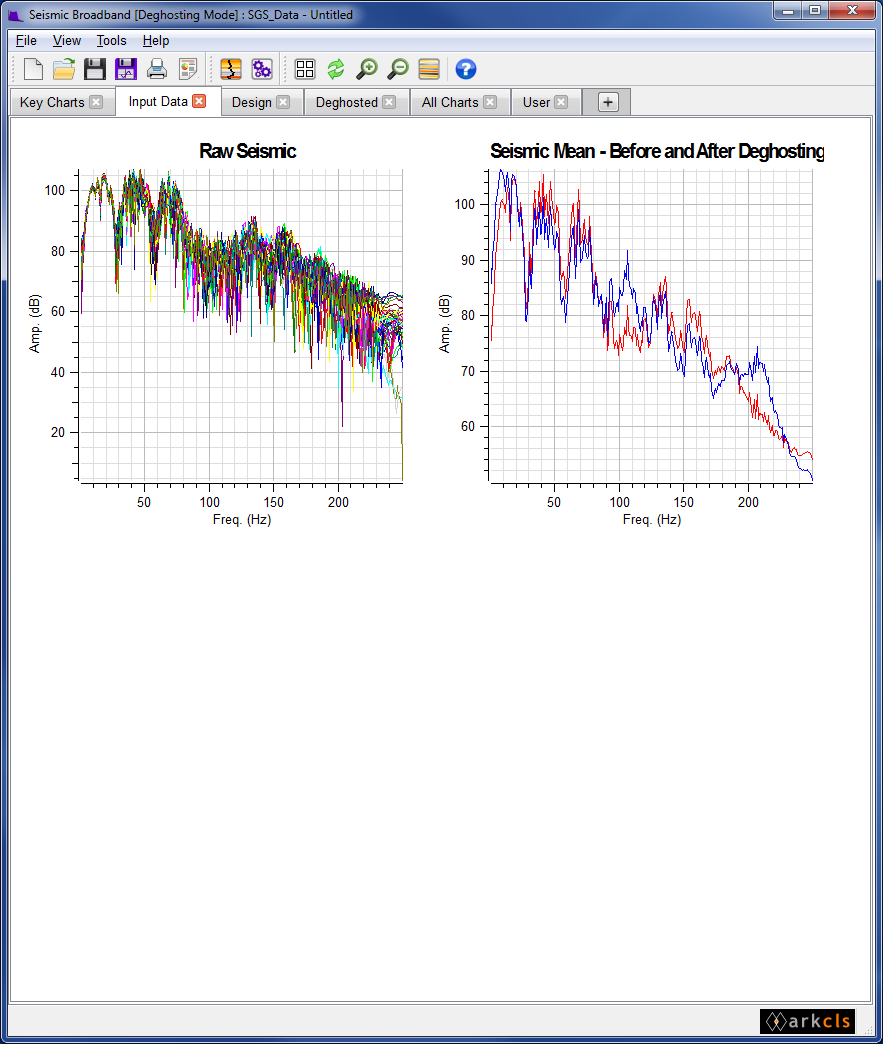
The figure above shows a typical Stack Ghost Suppression main window with the Input Data charts tab selected. The charts are from left to right and top to bottom:-
Raw Seismic
This chart displays the spectra for each of the set of seismic traces used for the analysis and design of the deghosting operator.
Seismic Mean Before and After Deghosting
The contents of this chart are described in the Key Charts section above.
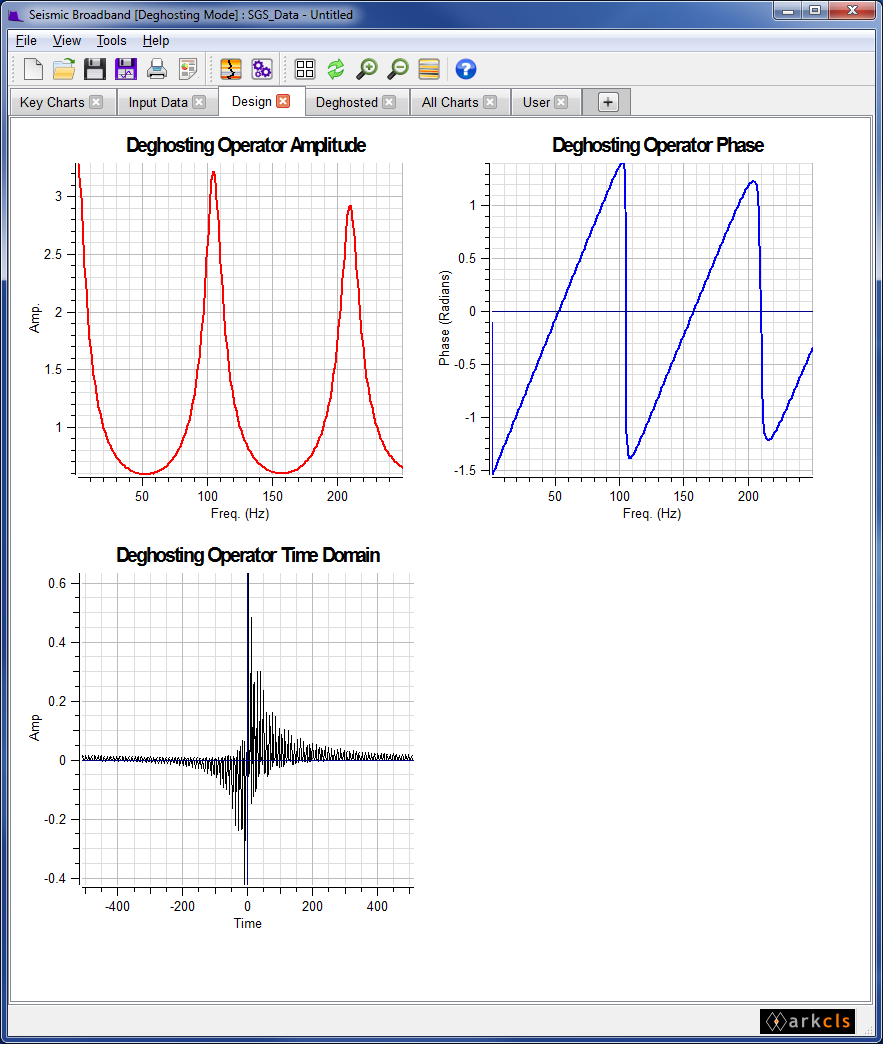
The figure above shows a typical SGS main window with the Design operator charts tab selected. The charts are from left to right and top to bottom:-
Deghosting Operator Amplitude
Displays the amplitude (gain) of the deghosting operator in the frequency domain.
Deghosting Operator Phase
Displays the phase in radians of the deghosting operator.
Deghosting Operator Time Domain
Displays the deghosting operator in the time domain.
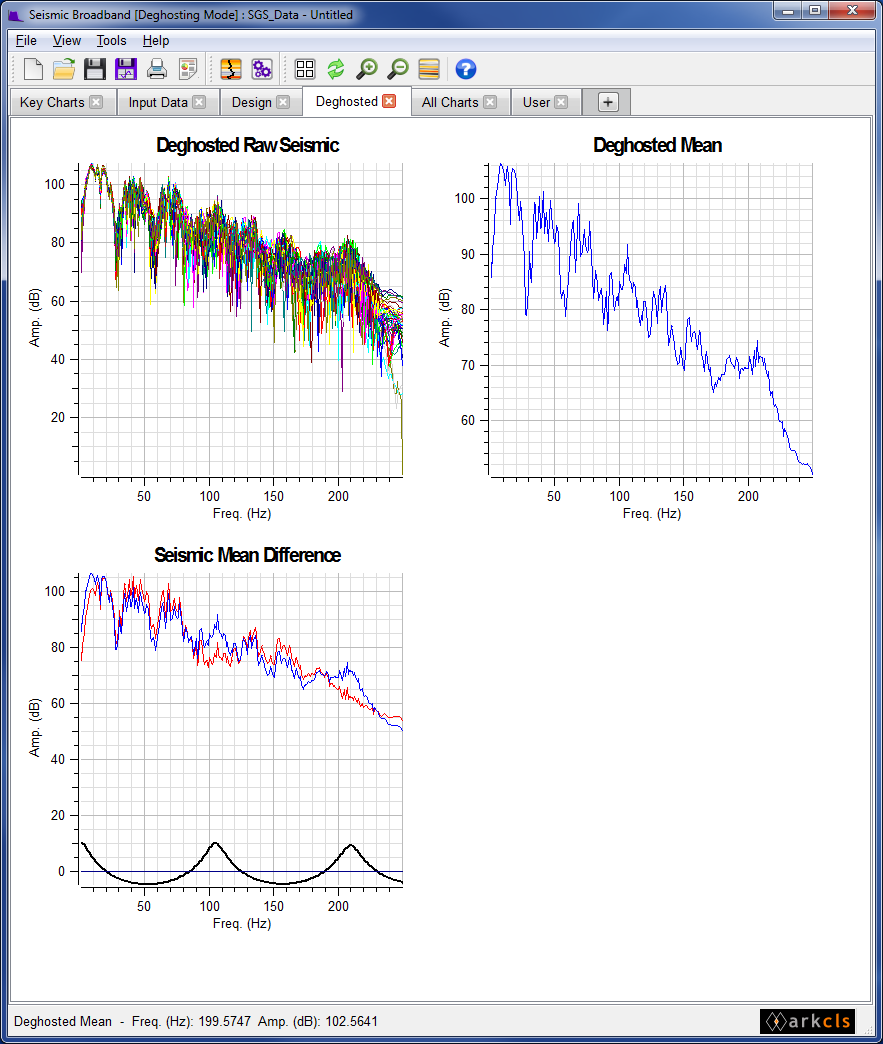
The figure above shows a typical SGS main window with the Deghosted charts tab selected. The charts are from left to right and top to bottom:-
Deghosted Raw Seismic
Displays the amplitude spectra (in dBs) for each of the set of seismic traces used for the analysis and design after the deghosting operator has been applied.
Deghosted Mean
Displays the mean spectrum of all the raw spectra after the deghosting operator has been applied.
Seismic Mean Difference
This chart displays the mean spectrum of all the raw spectra before (red) and after (blue) the deghosting operator has been applied The difference between the Before and After is displayed in black. This is essentially the deghosting operator in the frequency domain.
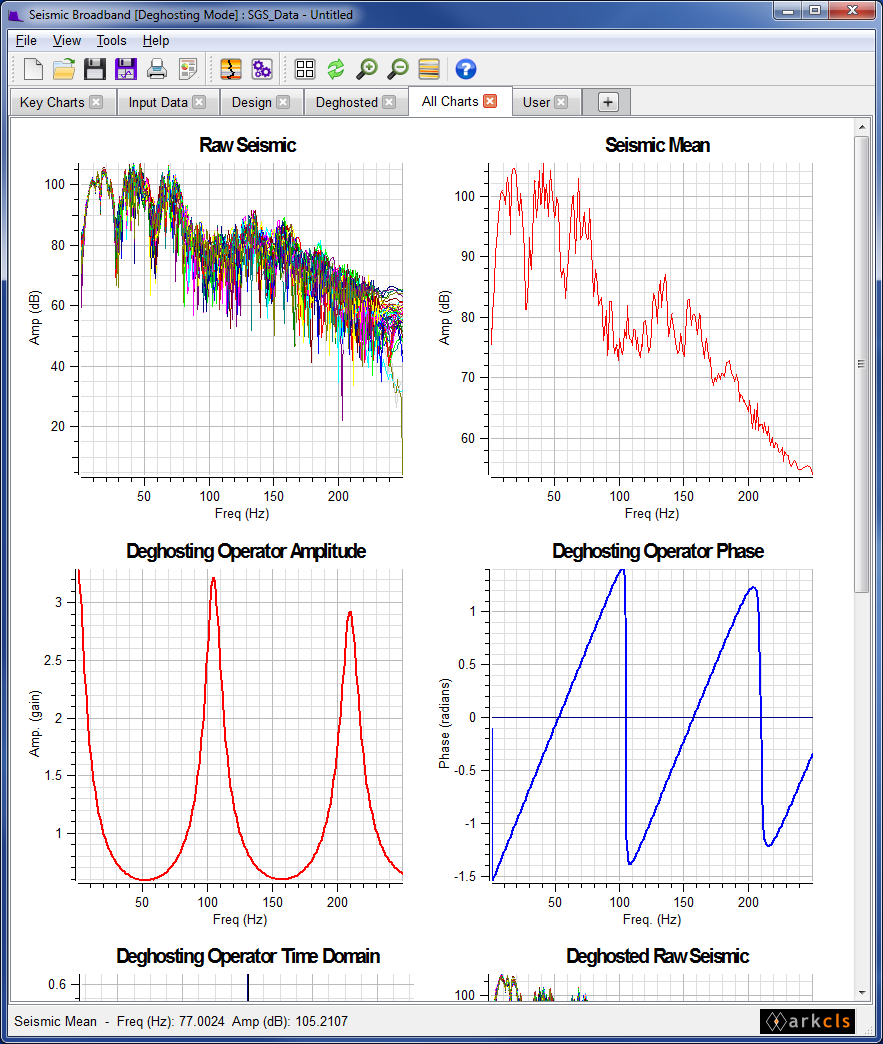
The figure above shows a SGS main window with the All Chart charts tab selected.
This tab contains all the charts discribed in the tabs above.
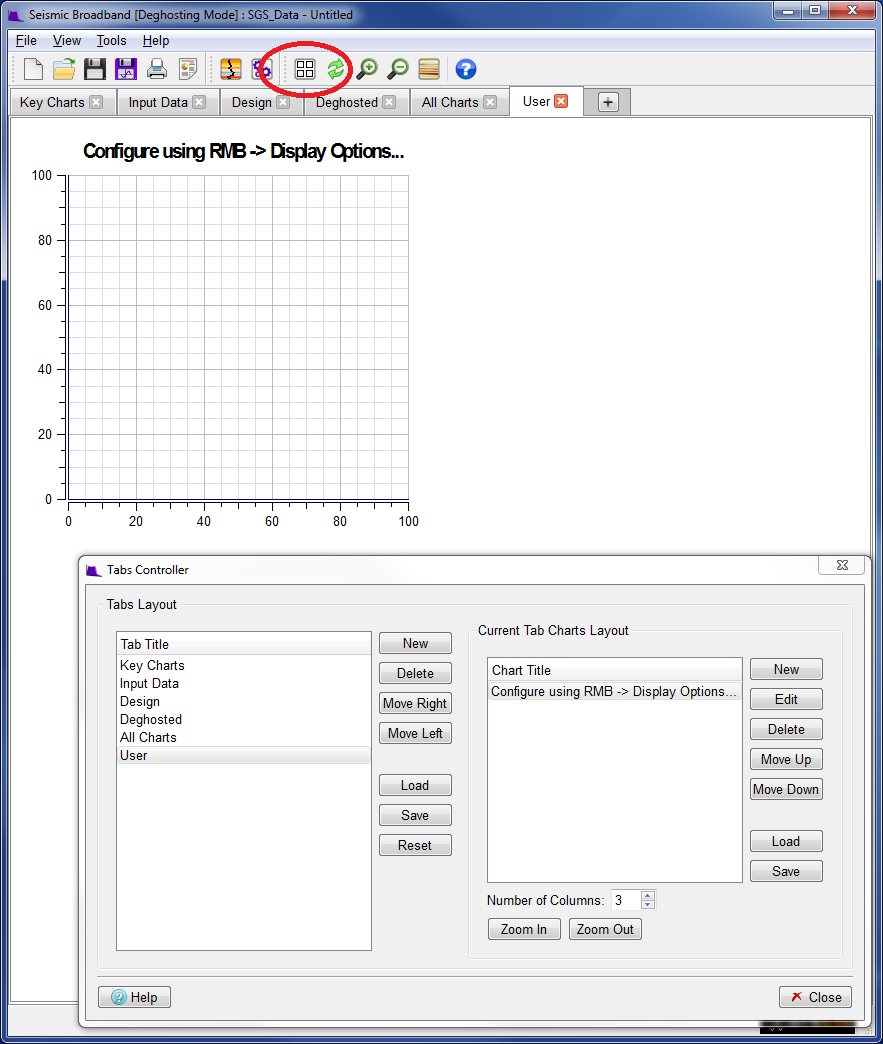
The figure above shows a SGS main window with the User Chart charts tab selected.
This is an emtpy chart that the user can configure him/herself. This is done by clicking the Tab Controller button icon (ringed in red in the figure above) then using the window to configure the chart.