To use this application to design the deghosting operators, a theoretical frequency sprectrum is calculated from the ghost notch frequency, (either source or receiver) notch diversity, receiver amplitude and the reflection coefficient at the sea surface. The operator is then applied to a selction of seismic traces to allow the effect of the parameters to be checked and tuned.
Therefore it is first necessary to analyse the seismic data spectra. This is achieved by loading some seismic trace data in time. Pop up the "Select Input Data" dialog by either clicking the menu item under the menu bar or by clicking the  icon.
icon.
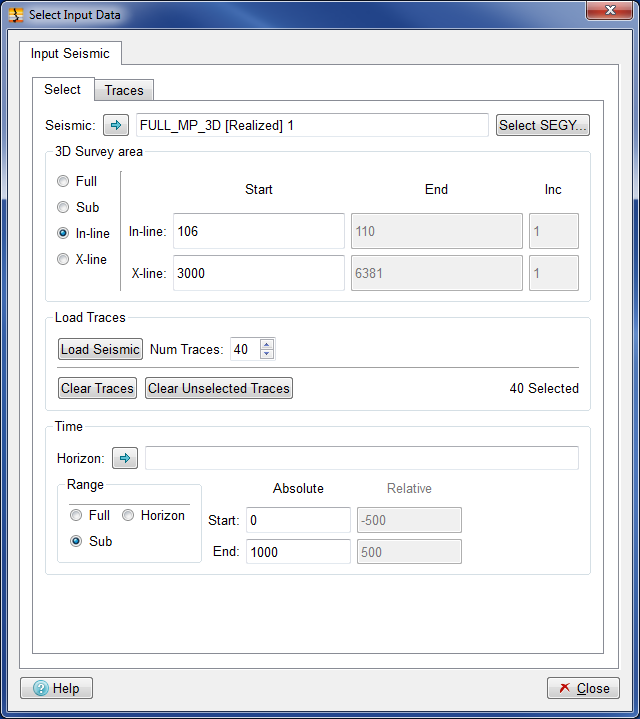
The figure below shows the Select Input Data window with an example of data selected for operator design. This application is data driven which means that the complete analysis and design of the operator (or as far as possible) is performed as soon as the data is loaded or updated.
This section describes how to select the input seismic trace data for use in the operator design. Stack Ghost Suppression requires that you select a predetermined number of seismic traces from the 3D survey area. Trace selection is either sequential along an inline or crossline or is random within the area of interest. The aim is to select a set of traces which is representive of the ghost, remembering that it is assumed to be uniform everywhere. With the data selected it will normally be necessary to constrain it in some manner. The sub-section below describe how you can select and constrain the trace data.
This section allows you to specify how traces are selected for analysis.
| Input Seismic tab from the Select Input Data window | ||
|---|---|---|
 | The picture to the left shows the Input Seismic window, where seismic data can be selected. |
With the seismic data selected it's usually desirable to define whether a set of sequential traces will be used or whether a set of random traces will be selected from either the Full or Sub area. The default is "In-line" meaning that a set of N traces will be selected sequentially along the chosen in-line starting from the selected cross-line. If "X-line" is chosen then N traces will be selected along the chosen cross-line starting from the selected in-line. The value "N" is controlled using the "Num Traces" spin-box. Be aware that increasing the number of traces could substantially slow down the analysis.
If "Full" is chosen then N random traces will be selected from the full 3D survey area. Or if "Sub" is chosen then "N" random traces are selected from a sub-area defined by the Start In-line, End In-line, Start X-line and End X-line edit boxes. Finally, the number of traces is specified and the button is clicked.
With the seismic data volume selected you can now load a set of traces to be analysed. Here you can optionally choose to select traces from the full 3D survey area or sub 3D survey area. This is achieved using the radio button group as follows:
for the complete area
and setting the In-line and X-line Start and End values for a sub-area
to select sequential traces along the specified in-line
to select sequential traces along the specified cross-line
Typically you would select traces from a single inline, crossline or a single sub-area. Specifying a traces in this manner enables you to include an area of the survey where the trace data is known to be of good quality and is representative of the survey area as a whole. With traces selected it is simply a case of specifying the number of traces to load (default 40) via the Num. Traces input field. Then click the button to load a set of traces. A list of the loaded traces is then displayed in the tab.
This software allows trace data to be selected from multiple lines, cross-lines or sub-areas. This is achieved by specifying another set of traces and and clicking the button again. The goal is to generate seismic trace spectral which is good representation of the area as a whole. If you attempt to specify an area which is outside of the available area then a warning message will be issued when you attemp to load seismic traces by clicking the button.
You wil also get an error message if you set an area which would not allow enough unique traces for the Num. Traces requested.
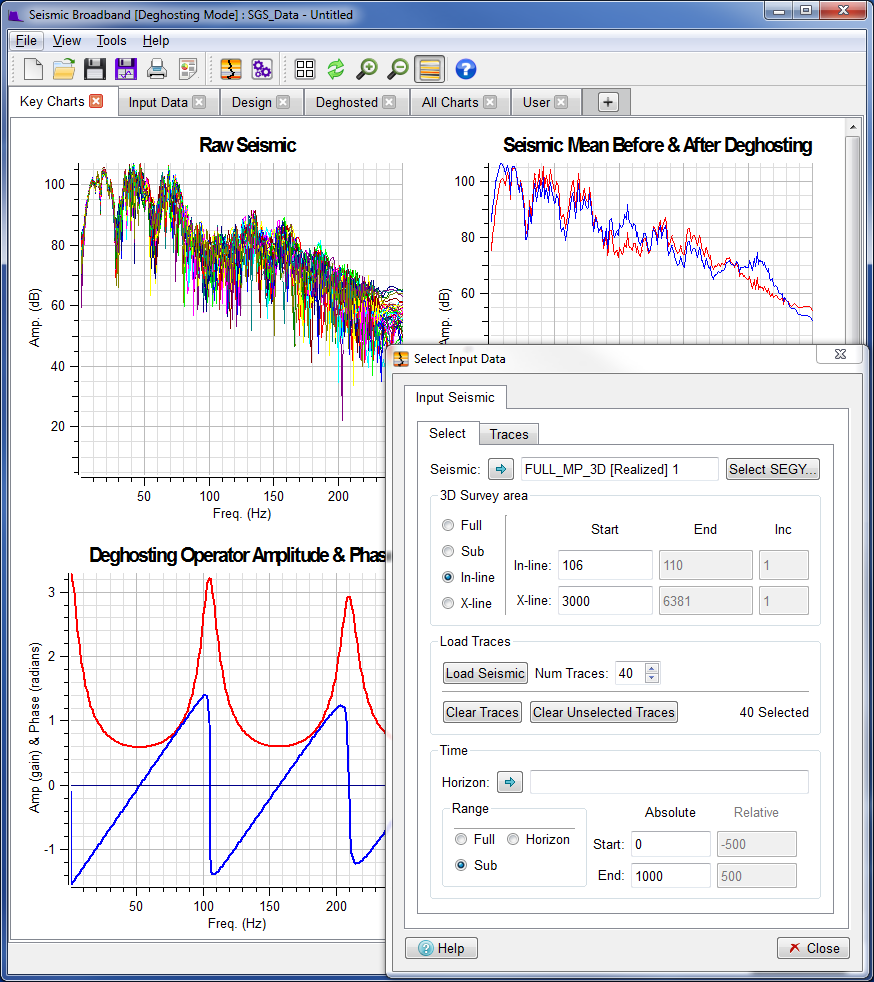 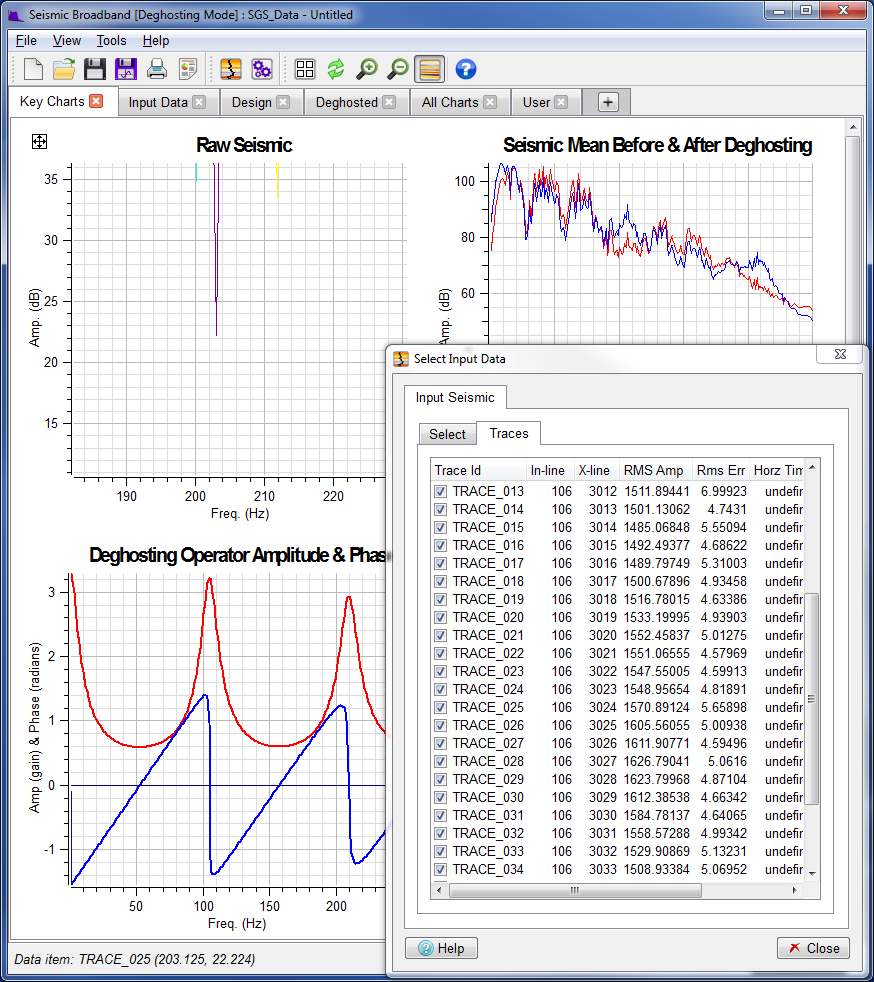 | The Main Window with Select Input Data Dialog superimposed (top left) shows the Raw Seismic spectra resulting from clicking the button on the "Select Input Data" window (above left) with Num. Traces set to 40. The "In-line" option is selected so 40 sequential traces will be selected from: In-line: 106 Starting from X-line: 3000 By default, all loaded traces are used in the spectra calculation and contribute to the Seismic Mean Spectrum. If one or more seismic trace spectra displayed on the Raw Seismic plot were anomalous then it is possible to remove those traces from the Seismic Mean Spectrum calculation. Let us assume that one of the traces has an anomalous RMS Amplitude or RMS Error value (these values can be viewed in the "Traces" tab in the "Input Seismic" window). If we wish to exclude a trace from the mean calculation, we must first identify it. This is achieved by pointing at one of the vertices of this spectrum and click on it. The click needs to be within one pixel of the vertices to be able to identify it, being anywhere on the plotted line is not sufficient. If we are within range when we click then the spectra name together with the Frequency and Amplitude of the vertice is displayed in the Status Area of the Main Window. In this case, the Raw Seismic spectra is identified as "TRACE_025". We can now go to the Input Trace list and click checkbox to the left of entry "TRACE_025. This causes the trace to be flagged as not currently selected and the Raw Seismic plot on the Main Window is updated accordingly. The Seismic Mean spectrum (red) on the chart changes as a consequence. |