Seismic Spectral Blueing is launched within the Petrel* seismic to simulation software.
* is a mark of Schlumberger.
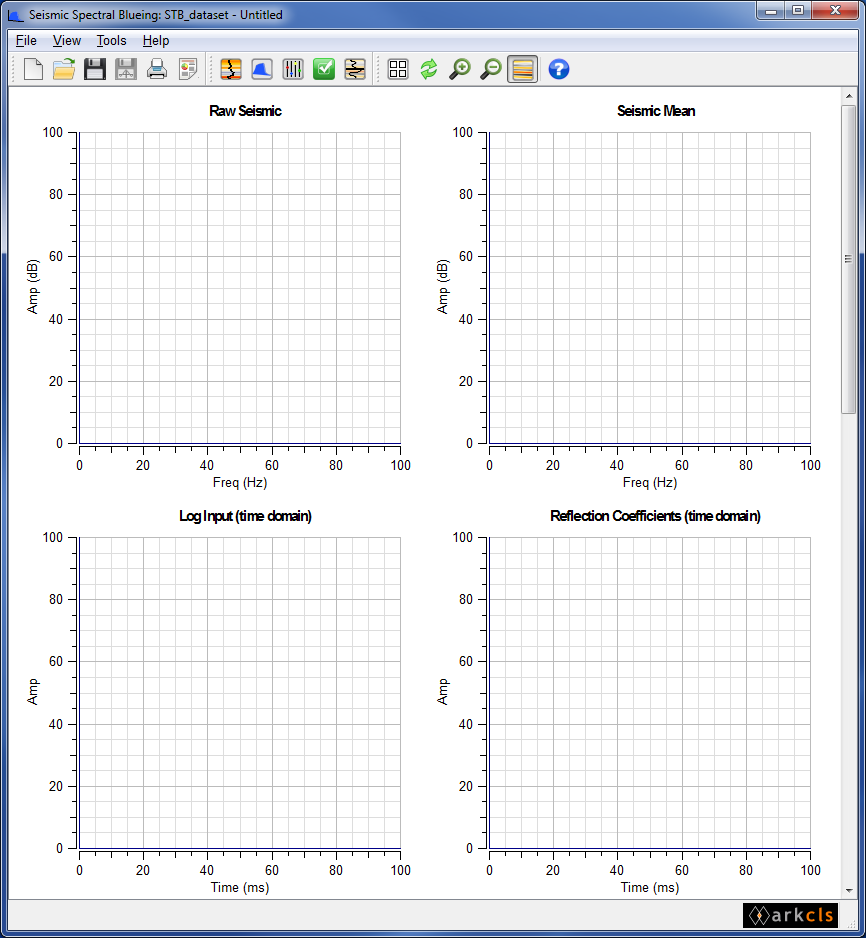
Once the SsbQt application has been launched, the SsbQt main window will be displayed as shown in the figure above. This window is the main interface to the application. The main window GUI consists of (from top to bottom): a menu area, an icon area, a chart area and a status area (see figure below). The chart area, which occupies the large scrollable central area of the main window, is used to display various charts of spectra and time data to provide feedback to the Interpretation Geoscientist in his/her quest to design a SsbQt operator.