This section describes how you interface with the SnpQt Main Window and Main Window ancillary tools.
Methodology:For a description of the process read: Conolly, P.A., 2005, Net pay estimation from siesmic attributes, EAGE Extended Abstracts. Conolly, P.A., October 2007, A simple, robust algorithm for seismic net pay estimation, The Leading Edge.
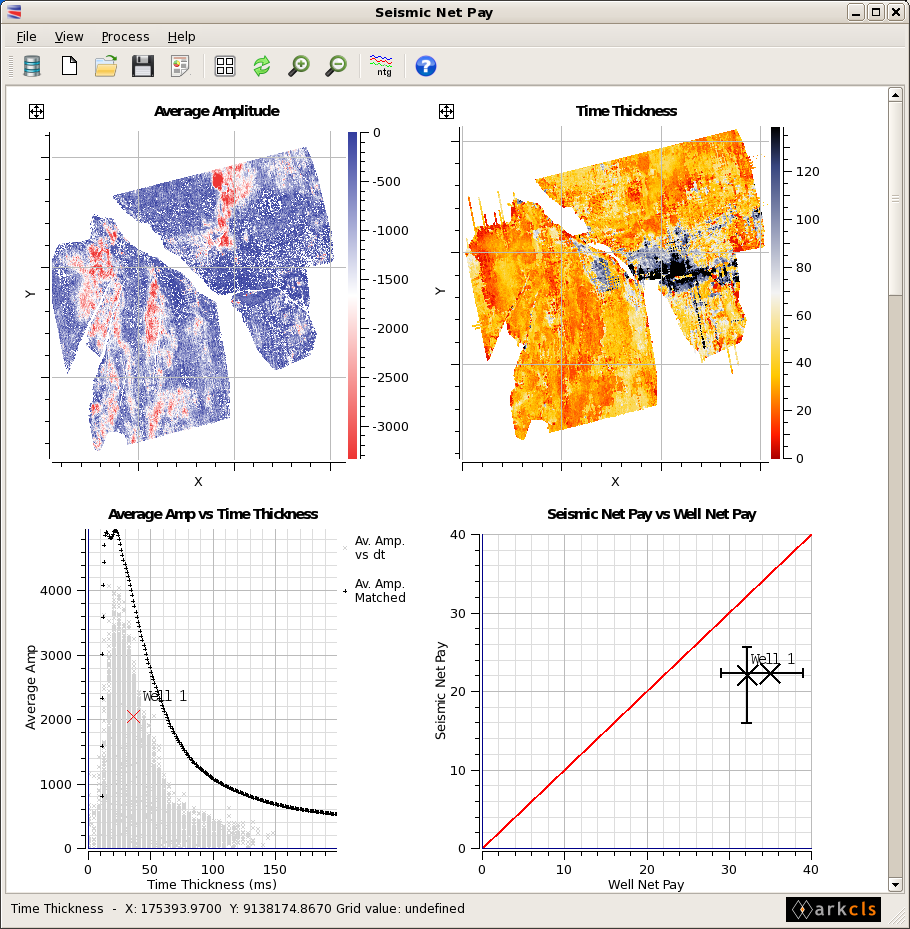
The Seismic Net Pay main window GUI consists of, from top to bottom, a menubar area, a toolbar area, a chart area, and a status area. The chart area, which occupies the large central area of the main window is used to view various charts of horizon and net pay data to provide instant feedback to the interpretation geoscientist.
This sub-section describes the actions performed by the various menu items
| Creates a new SnpQt session (shortcut Ctrl+N). | |
| Opens a previously saved SnpQt project (shortcut Ctrl+O). This facility allows you to restore the SnpQt parameters together with the data from a previously saved session. Restoring a previously saved session can take a few moments while database access is established. Note, if the stored data within the database has been modified since the session save time, then it is possible that different results may be generated following a session restore. | |
| Saves a SnpQt project (shortcut Ctrl+S). This allows the SnpQt parameters, together with information about the data used, to be saved. In this way, data can be easily reloaded and the Net Pay results generated at some future date. If this is the first time that this is saved then the user will be presented with a file selector dialog for this purpose (shortcut Ctrl+S). | |
| Saves the current SnpQt session under a different name. A file selector dialog will pop-up for this purpose. See "Save" above for more details. | |
| Pops up a dialog which displays various seismic net pay parameters nicely formatted (shortcut Ctrl+R). | |
| Save a screen shot to a file. | |
| Exits the SnpQt application. |
| Pops up the "Chart Controller Dialog" which will allow you to modify various chart parameters within the central area of the main window. | |
| Redraws all the charts within the central area of the main window. | |
| Provides a global zoom-in facility which makes the central chart area grow by a fixed amount each time this menu item is clicked. There is an upper maximum (shortcut Ctrl++). | |
| Provides a global zoom-out facility which makes the central chart area shrink by a fixed amount each time this menu item is clicked. There is a lower minimum (shortcut Ctrl+-). |
| Pops up the "SNP Processing Controller Dialog" which will allow you to conduct the process of Net Pay calculation (shortcut Ctrl+T). |
| Pops up an HTML browser displaying the Quick Start document. | |
| Pops up an HTML browser displaying Contents page for software user guide. | |
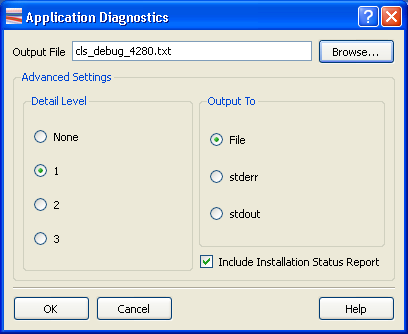
| Pops up dialog allowing application diagnostics to be specified. | |
| Pops up an HTML browser displaying the home page of ARK CLS Limited website. | |
| Pops up the About SnPQt window. |
This sub-section describes the actions performed by the various toolbars and their icons. The toolbars can be positioned in various locations within the main window top (default beneath the menu bar), left, right and bottom (above status area). Additionally, the toolbars can be moved off the main window altogether and anchored on the desktop. To move the toolbar to a new location grab the handle at one end of the toolbar by pressing and holding mouse button 1 and dragging to the new location.
 | Creates a new SnpQt session. |
 | Opens a previously saved SnpQt project. This facility allows you to restore the SnpQt parameters together with the data from a previously saved session. Restoring a previously saved session can take a few moments while database access is established. Note, if the stored data within the database has been modified since the session save time, then it is possible that different results may be generated following a session restore. |
 | Saves a SnpQt project. This allows the SnpQt parameters, together with information about the data used, to be saved. In this way, data can be easily reloaded and the Net Pay results generated at some future date. If this is the first time that this is saved then the user will be presented with a file selector dialog for this purpose. |
 | Pops up a dialog which displays various seismic net pay parameters nicely formatted. |
 | Pops up the "Chart Controller Dialog" which will allow you to modify various chart parameters within the central area of the main window. |
 | Redraws all the charts within the central area of the main window. |
 | Provides a global zoom-in facility which makes the central chart area grow by a fixed amount each time this menu item is clicked. There is an upper maximum. |
 | Provides a global zoom-out facility which makes the central chart area shrink by a fixed amount each time this menu item is clicked. There is a lower minimum. |
 | Pops up the "SNP Processing Controller Dialog" which will allow you to conduct the process of Net Pay calculation. |
 | Pops up an HTML browser displaying Contents page for software user guide. |
This is the main functional area of the SnpQt application. Is is used to display various charts that provide graphical feedback over the operation of the Seismic Net Pay operation.
The chart area is highly configurable allowing you to tailor this area with charts and data which meet your project needs. Once you have configured this area, it can be saved in a project for future re-use.
The following charts are initially available:
Chart 1 Average Amplitude - This chart displays values from the selected average amplitude horizon attribute extracted from the Time Thickness horizon data.
Chart 2 Time Thickness This chart displays the map of time thicknesses (isochron) between two horizons picked at the top and base of the reservoir.
Chart 3 Average Amp vs Time Thickness This chart displays a cross-plot of Average Amplitudes against Time Thicknesses derived from the above two charts. The wedge model filter response is scaled to the peak average amplitude extracted from the input average amplitude map and is over-plotted on this chart.
Chart 4 Seismic Net Pay vs Well Net Pay This chart displays the well position in terms of it's well net pay to seismic net pay ratio with error bars.
Chart 5 Wedge Model This chart displays a band-limited impedance wedge calculated by applying a user defined wavelet to a simple low-impedance wedge.
Chart 6 Wedge Calculation This chart displays scaled Average Amplitude and scaled Seismic net to Gross, both derived from the Wedge Model.
Chart 7 Time - Depth Correction This chart displays the Time to Depth correction curve. This will plot a curve when the velocity ratio of Pay to Non-pay is not 1.
Chart 8 Correction Curve This chart displays the detuning transform used to convert from average band-limited impedance to seismic net-to-gross.
Chart 9 Relative Correction Curves This chart displays the two relative correction curves calculated from the upper and lower frequency ranges from the Uncertainty tab.
Chart 10 Normalised Std.Dev. (for ntg of 1) This chart displays the expected wavelet uncertainty values for the gross thickness range of the data (for a net-to-gross of 1).
Chart 11 Net to Gross (Time) This chart displays a map of computed net-to-gross in time.
Chart 12 Net to Gross (Depth) This chart displays a map of of depth converted (using the velocity ratio of pay to non-pay) net-to-gross values.
Chart 13 Net Pay This chart displays the product of (depth converted) seismic net-to-gross and apparent thickness know as Net Pay.
Chart 14 QC This chart displays a map of "confidence" values either 1, 2 or 3.
Chart 15 Bias Uncertainty This chart displays the sum of Wavelet and Scaling Uncertainty net-to-gross standard deviation values.
Chart 16 Total Uncertainty This chart displays the sum of the Bias Uncertainty and Amplitude Uncertainty net-to-gross standard deviation values.
The status area at the bottom of the main window is used to display various messages and other information for you. It is used to display information about a given chart as the mouse passes over the central area of the main window.
The Application Diagnostics dialog is used to report installation and processing information about the SNP application. Varying levels of detail can be provided, but it should be noted that the operation of the SNP process will be slowed with increasing levels of output detail. It is suggested that the application diagnostics panel is only used when there is a particular issue that needs detailed investiagation.