A seismic viewing utility is available from within the SciQt application. It is accessed by pressing the ![]() button on the tools menu bar. This allows both the currently selected seismic volume from SciQt, and the result of applying the convolution operator to be viewed. The convolved data is updated in real time using the currently derived operator. This allows the SciQt user to accurately assess the results of their operator on a single line, before undertaking the more time consuming operation of applying it to a whole volume.
button on the tools menu bar. This allows both the currently selected seismic volume from SciQt, and the result of applying the convolution operator to be viewed. The convolved data is updated in real time using the currently derived operator. This allows the SciQt user to accurately assess the results of their operator on a single line, before undertaking the more time consuming operation of applying it to a whole volume.
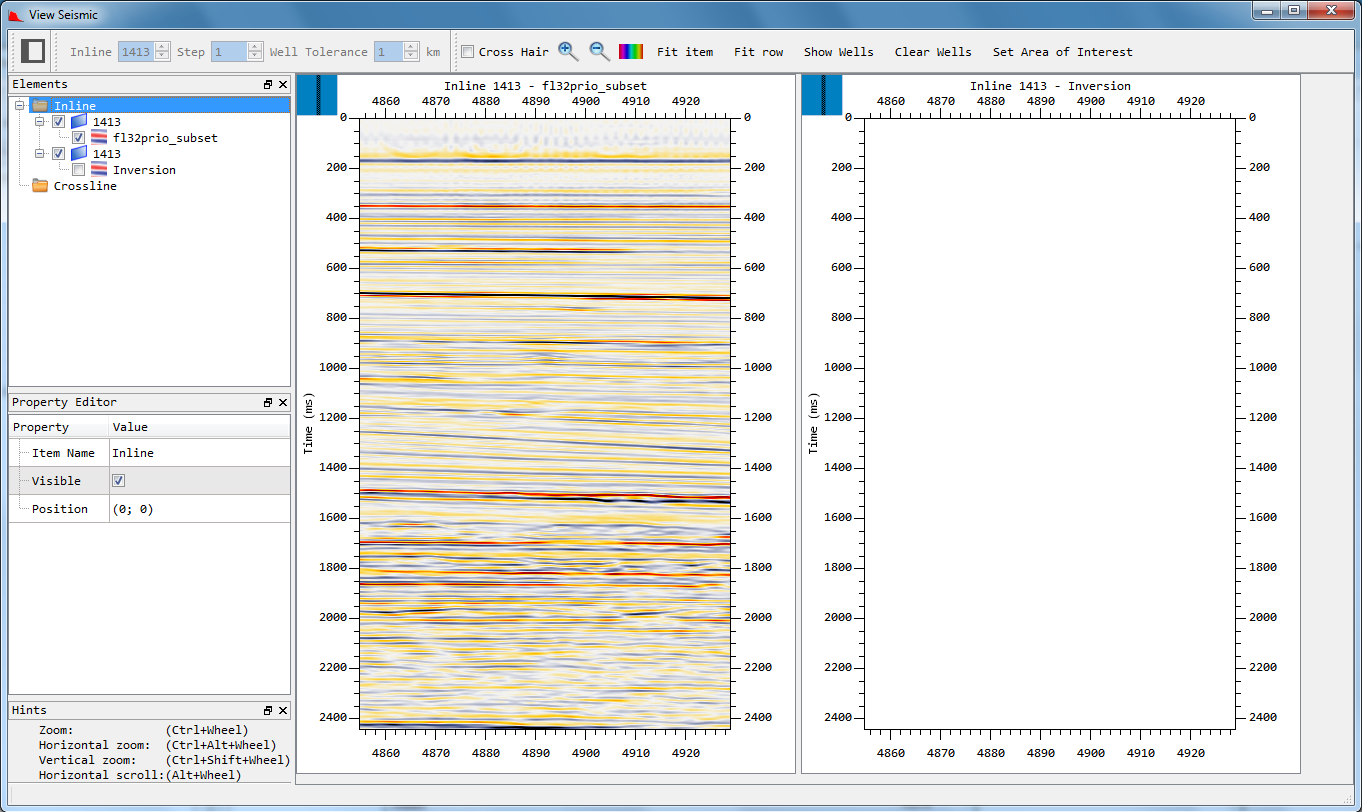
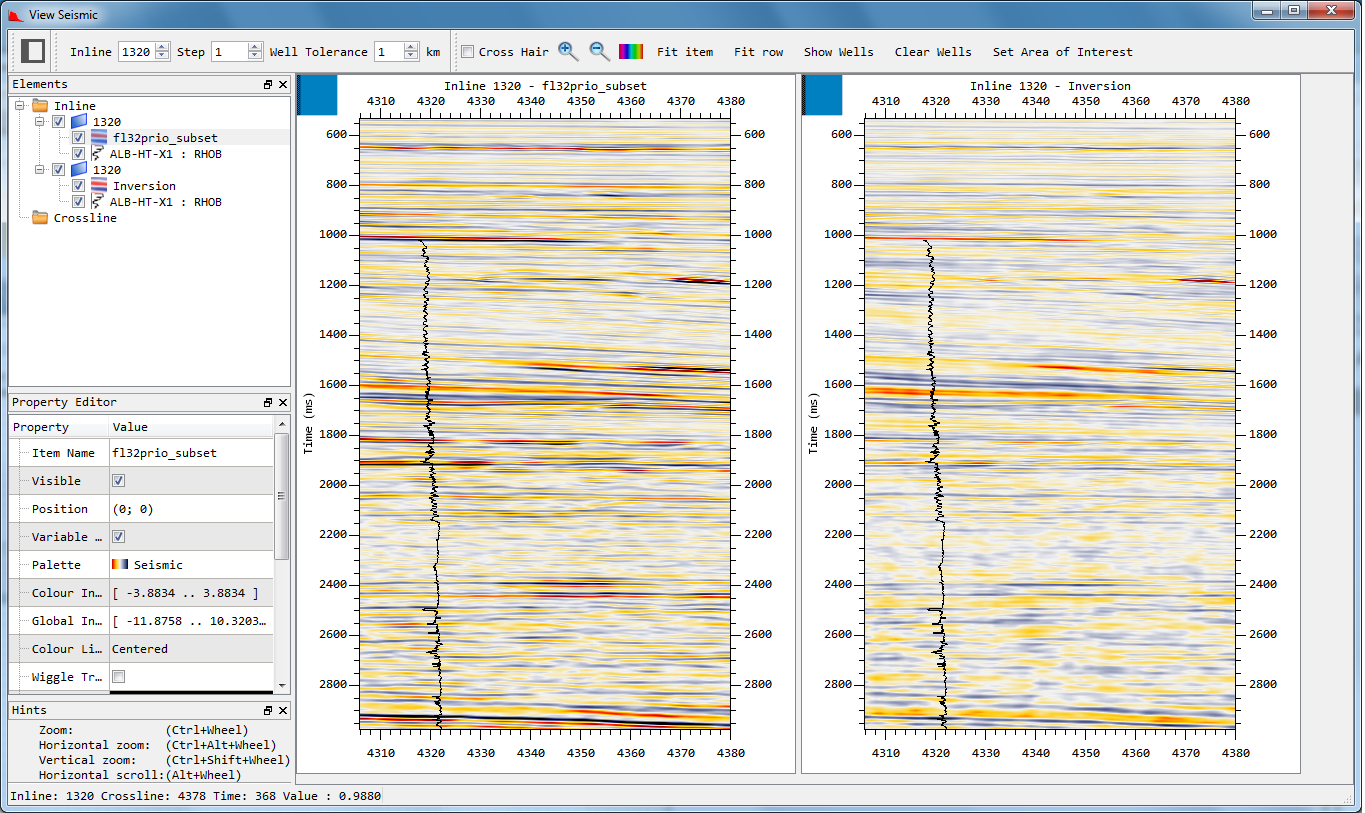
When the seismic view is first displayed, it contains two panels within the seismic display area. The left panel shows an example inline from the seismic volume that is currently selected by the SciQt application. Initially an inline from the central region of the volume is shown. The right panel is for displaying the result of applying the currently derived inversion operator to the same inline. Initially this right panel is blank. This is normal. Once you have selected seismic volume and loaded some trace data and have also selected one or more well log impedance data, then a coloured inversion operator will be automatically generated and applied to the current inline. The right panel will then be updated displaying the results of the convolution. You are then free to optimise your coloured inversion operator, using the Design Operator and Advanced Controls dialogs, viewing the results of any changes in real time.
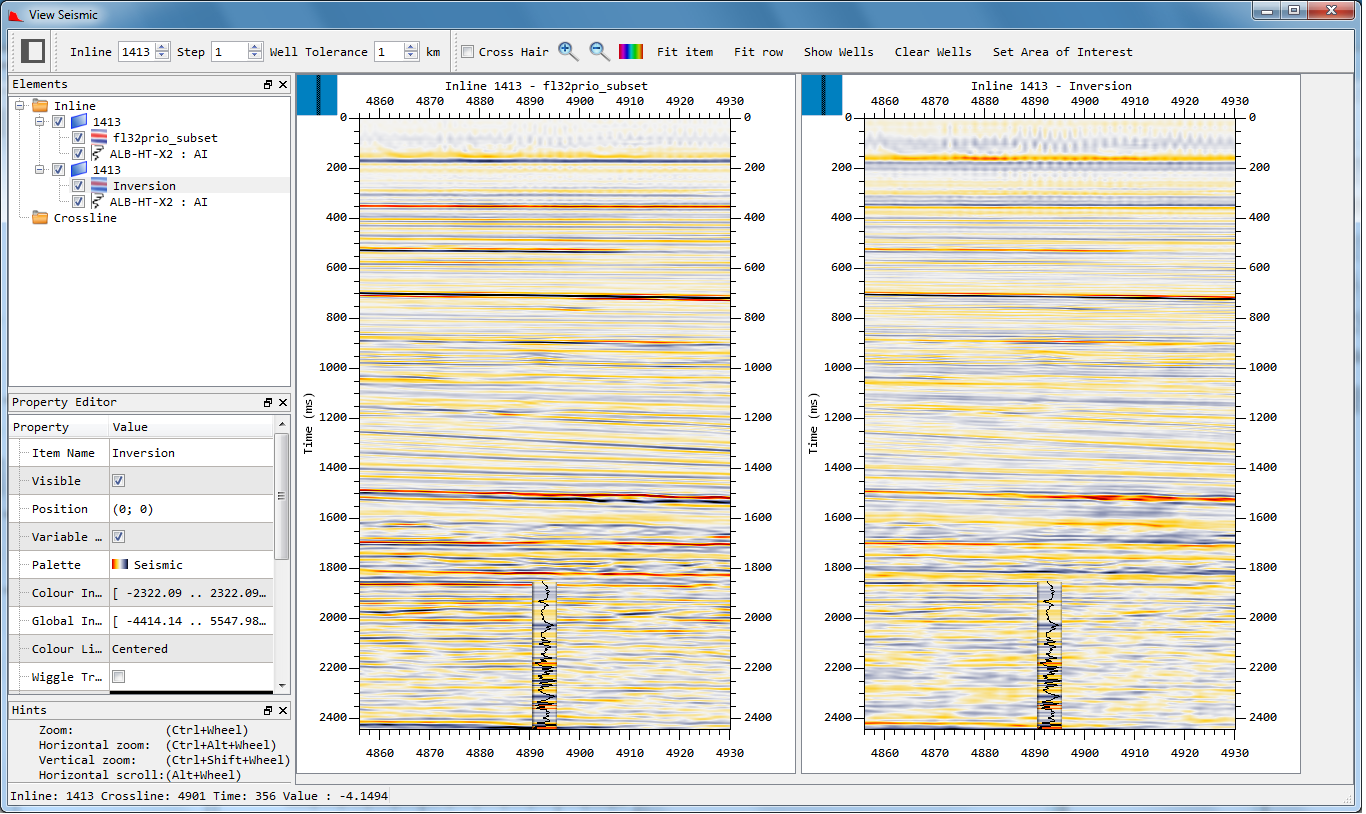
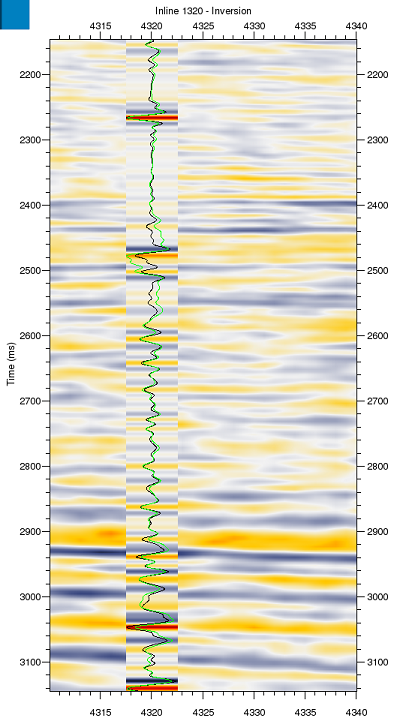
The figure above shows the input and inverted seismic with a band-limited impedance trace overlayed. This has been created by convolving the Acoustic Impedance log with the output Band-Pass filter to create a band-limited impedance trace. This has been overlayed on the seismic at the well location to provide a QC of the quality of the Inversion Output. This is done for each well. The user can quickly switch between well locations by opening the elements panel by clicking the square at the top-left, and then by double clicking on a well in the data tree.
The SCI algorithm assumes the input data is zero phase. If not zero phase it will be manifested by a miss-tie with the log overlay. A phase rotation can be applied in the Design Operator dialog window.
The diagram above shows the appearance of the viewer after an operator has been derived.
The seismic viewing utility consists of a toolbar area, an elements selection panel, a property editor, and the seismic display area which occupies the large central part of the seismic view. This area can be used to show a number of seismic panels which can display input or convolved data from the seismic volume that is being analysed.
The top section of the seismic viewing window shows two toolbars allowing selection of inline/crossline, cross hair toggling, zoom in/out controls, colour palette selection, Fit item, and Fit row controls. The toolbars can be positioned at various locations by simple drag and drop using mouse button 1.
The inline/crossline selection tool allows the currently selected inline or crossline to be changed. The choice of whether this control is affecting inline or crossline position is made by either selecting a panel in the seismic display area of the viewer or by selecting 'Inline' or 'Crossline' from the 'Elements' display. When the inline or crossline is changed, the selected seismic (and convoluted) panels in the main display area will update immediately to show data for the selected inline/crossline.
| Description. | |
| Toggles the cursor between a simple arrow, and a cross-hair. | |
 | Increases the size of all the seismic panels in the seismic display area. |
 | Decreases the size of the seismic panels in the seismic display area. |
| Starts a tool that allows the colour palette of the currently selected seismic data in the 'elements' selection view to be changed. | |
| Forces the currently selected seismic panel to fit the whole of the display window. | |
| When multiple seismic panels are being displayed they will scaled so that a row of two seismic panels will fit within the display window. | |
| Shows Wells user specified wells selected for the calculation of the colored-inversion operator to be displayed within the sesimic view panels. The default palette for the log overlaid is "Seismic" and cannot be varied. | |
| Clears wells displayed in Seismic or Colored inversion panels. | |
| The seismic displayed within Seismic View is based on the 3D survey area, the Seismic time-gate range and Well log time range selections done as part of "Select Input Data". |
Right click on an in-line or cross-line number to pop up the above context menu. Below is a description of the supported menu items.
Note that not all options are supported on all platforms.
| Description. | |
| For more details see the section below on "Selecting Seimsic Data". | |
| Select additional well logs for display. Full availability in OpendTect plugin - see below. The OpenWorks version allows selection of other AI logs | |
| Select and add ASCII well logs. For more details see below. | |
| Select and add a horizon. (Supported on OW/GF/OD/PET). Browse to the required horizon. Several horizons can be added except in the Petrel plugin version which only allows the the horizon used for time gating to be displayed. | |
| The default seismic panels are synchronised. Select "Unsync" to unsynchronise them. To Synchronise panels select the in-line (or cross-line) numbers for each panel you wish to synchronise (Alt-left click) then right-click for the context menu. Select "Sync Seismic Panels". This is useful if a set of cross-line seismic panels are added. | |
| Pop-ups up the "Select trace/z range for display" window.. | |
| Removes the selected seismic panel. |
OW = SeisWorks. GF = GeoFrame. OD = OpendTect plug-in. PET = Petrel plug-in. SEGY = SEGY file
The Elements selection panel allows the user to choose which seismic data is available to view in the main display area of the seismic viewer. Although the elements panel has already been configured for optimal SciQt usage, it can still be used to add additional seismic data to the main seismic display area as seen from the figure below.
Add a new inline/crossline: At its top level, the Elements control contains a list of inlines and crosslines that are available for display. To add an additional inline or crossline, right-click the word 'inline' (or 'crossline') and select 'Add Seismic Panel'. At this point a dialog will appear allowing the user to select a trace range and time range for the new display panel. It is suggested that unless otherwise required, the default extents are accepted. The extents can be adjusted either by using the spin boxes for min/max traces and min/max time samples or by grabbing the edges or corners of the blue box and dragging. Additionally, by grabbing within the blue box you can move it to a different region for the selected inline or crossline. A new entry will appear in the inline or crossline list in the elements view, labeled by the number of it's inline/crossline. By default the inline or crossline is through the centre of the survey area.
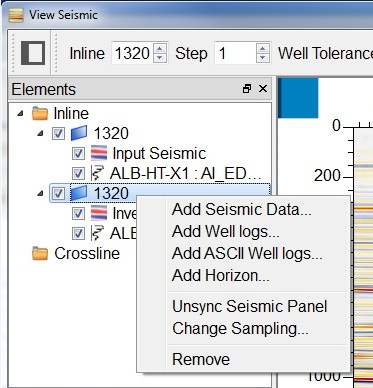
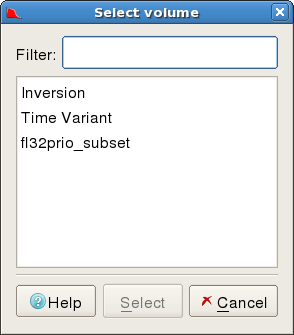
Add a Volume: Each numbered inline/crossline in the elements list can in turn have one of two volumes associated with it. These are the current volume that has been selected by the SciQt application and the volume produced by applying the current operator. To add a volume to a given inline/crossline, right-click on the desired inline/crossline number within the Elements display. Choose 'Add Seismic Data' and select the requested volume from a list that will appear. The named volume will then appear as an entry under the selected inline/crossline.
Display a volume: Seismic volumes at given inline/crossline positions can be displayed or hidden by clicking on their associated checkboxes within the Elements panel.
The elements selection panel can be closed or moved to other sections of the screen by clicking on its title bar and dragging with mouse button 1.
Well logs can be added to the seismic view. Right-click within the element tree and choose "Add Well Logs" to add Raw logs within Seismic View. Logs selected are not used for calculating the colored inversion operator.
Note that in the OpenWorks version users are restricted to being only able to select Acoustic Impedance logs from the list.
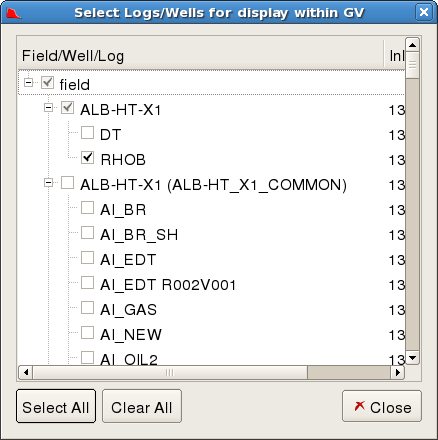
The figure about shows the seismic displays with log data overlayed. Log data can be selected for display by first opening the elements panel by clicking the square at the top-left. Next Right-Click on the inline (or crossline) number and click on Add Well Logs. A list of available logs is displayed for each well; check the logs required for display and click OK. Logs can be removed by unchecking the box next to the name.
ASCII Well logs can be added to the seismic view. Right-click on the in-line or cross-line number within the element tree and choose "Add ASCII Well Logs" to add logs from an ASCII file. IMPORTANT: the log data should be regularly sampled in time (preferably 1ms sample rate) for these logs to be used.
The log data will be band-limited for display using the filter corner frequencies secected in the Design Operator window. If the raw (unfiltered) log data is also required then tick the Unfiltered option in the Property Editor pane below the Elements tree.
Other properties can be changed in the Property Editor such as the gain, polarity, line width and colour.
Logs selected here are not used for calculating the colored inversion operator.
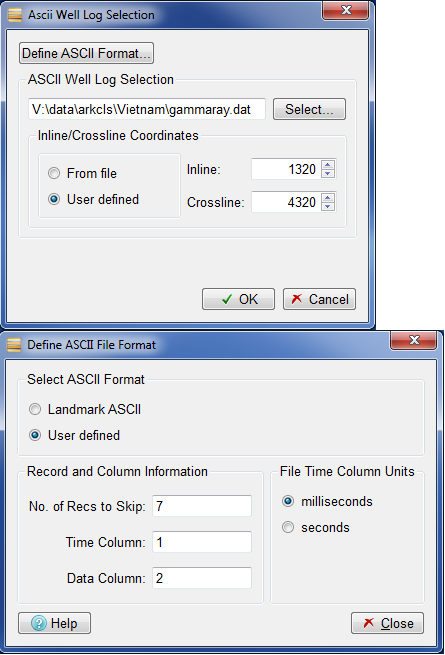
From the section window press the "Define ASCII Format" button to define the format of the log file. "Landmark ASCII" means the "Syntool" format (from Landmark). If "User defined" is selected then supply the four pieces of information requested: the number of header lines to skip before the actual data is reached, the column number for the Times (note, this must be Time not Depth), the column number for the log data itself, and whether the times are seconds or milliseconds.
Then in the selection window browse to the file containing the log data. If the file is in Landmark format then it is possible to edit the file to add location information. Otherwise select "User defined" and supply the in-line and cross-line location of the well. Click OK to load and display the log data.
The figure above shows the seismic displays with a gamma ray log overlayed. The filtered log is in black and the unfiltered in green.
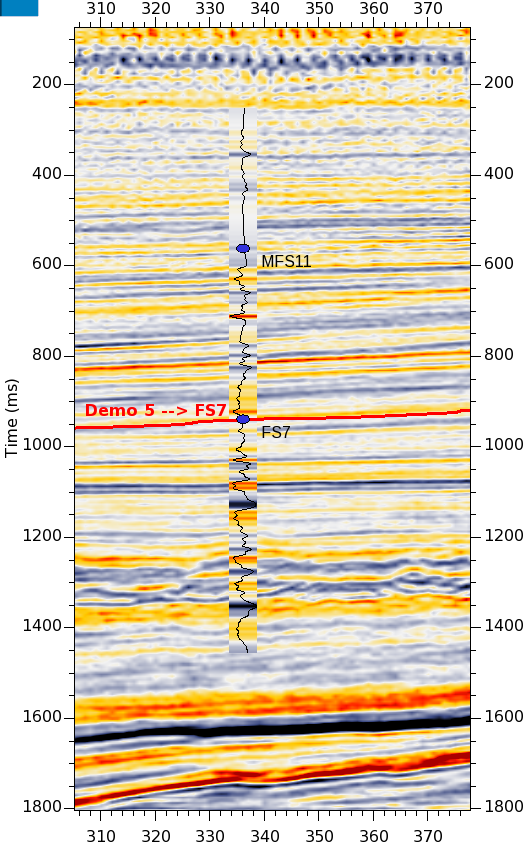
The picture above shows a well log with two well markers (tops) displayed on it. Markers are displayed automatically if selected as the Time Gating method in Time Section. See section "Modify Well Log Time Range (Well Markers/Tops)" for details. The seismic traces also have a horizon ovelayed. See "Add Horizon..." above for details.
The Property selection panel allows the user to view and optionally alter values of the currently selected item. When a panel is clicked on in the main window, or an item selected in the elements view, properties describing the selected item are displayed (e.g. 'Top Annotation' or 'Left Annotation'). Changing these values will alter the way in which seismic data is displayed in the main viewing window. The list of properties that can be altered depends on the selected item in the 'Elements' controller.
This panel can be closed or moved to other sections of the screen by clicking on it's title bar and dragging with mouse button 1.
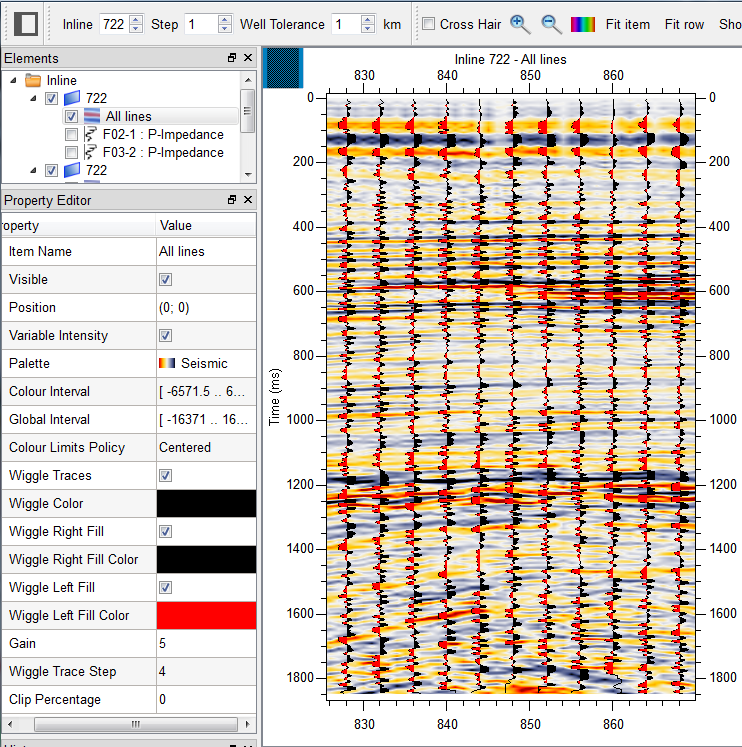
The figure below shows a seismic volume displayed as Variable Intensity with wiggle traces overlayed. A number of of the wiggle trace parameters have been changed from their default settings in the Property Editor. Here, the wiggle Left Fill has been turned on and the Left Fill Color changed to red. The Gain has been increased from 1 to 5 and the Wiggle Trace Step has been increased from 1 to 4 to improve clarity:-
| Property | Description |
| Variable Intensity | Toggles the display of the seismic data as a variable intensity image |
| Palette | Select the colour palette to use for the variable intensity display. Typical values are red-white-blue, or white-black. |
| Wiggle Traces | Toggles the display of wiggle traces. |
| Wiggle Right/Left fill | Choose whether to display the off center parts of a wiggle trace in a specified colour. |
| Gain | Increases the displayed amplitude of wiggle traces. |
| Wiggle Trace Step | Specifies the number of traces to skip between successive wiggle traces. With large amplitudes, wiggles can appear to merge into each other unless suitable trace step is chosen. |
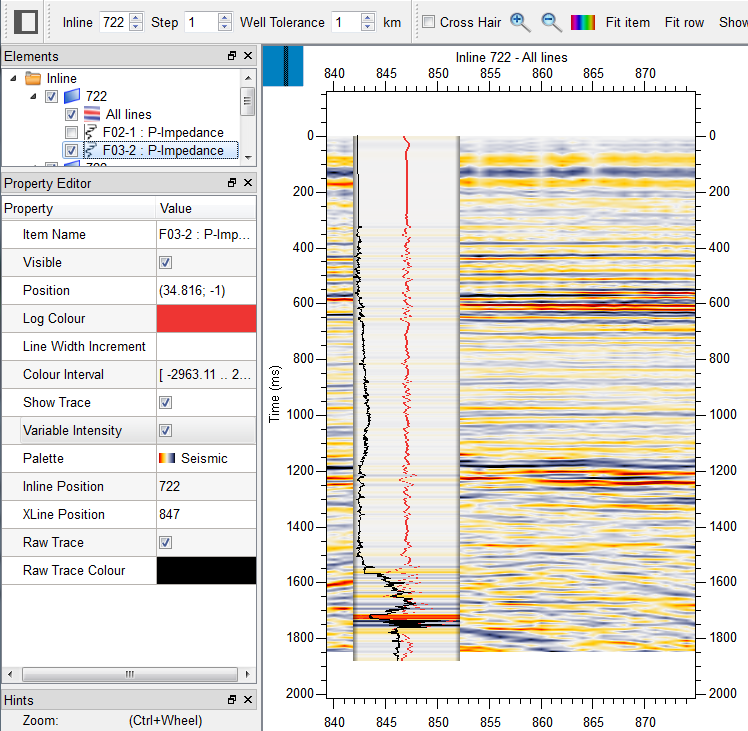
In the figure below a well log is selected in the 'Elements' controller. Some of the default settings have been changed in the Property Editor. Here, the Log Colour has been changed from black to red and the unfiltered log has been turned on:-
| Property | Description |
| Inline Position | Displays the inline position of the well log. |
| Xline Position | Displays the crossline position of the well log. |
| Variable Intensity | Toggle the display of the variable intensity image for the well log. |
| Reverse Log Polarity | Toggles the polarity of the log trace data. |
| Palette | Select the colour palette to use for the variable intensity display. Typical values are red-white-blue, or white-black. |
| Display Time Offset | Allows the user the shift the well log display along the seismic. |
| Display Time Start | Allows the user to set the start time of the well log. |
| Display Time End | Allows the user to set the end time of the well log. |
| Filtered Log | Toggle the display of the filtered log. |
| Reverse Log Polarity | Toggles the polarity of the filtered log. |
| Filtered Log Gain | Increase or decrease the filtered log amplitude. |
| Filtered Log Colour | Specify the colour of the filtered log. |
| Line Width | Specify the width of the filtered log. |
| Unfiltered Log | Toggles the display of the unfiltered log. |
| Unfiltered Log Colour | Specify the colour of the unfiltered log. |
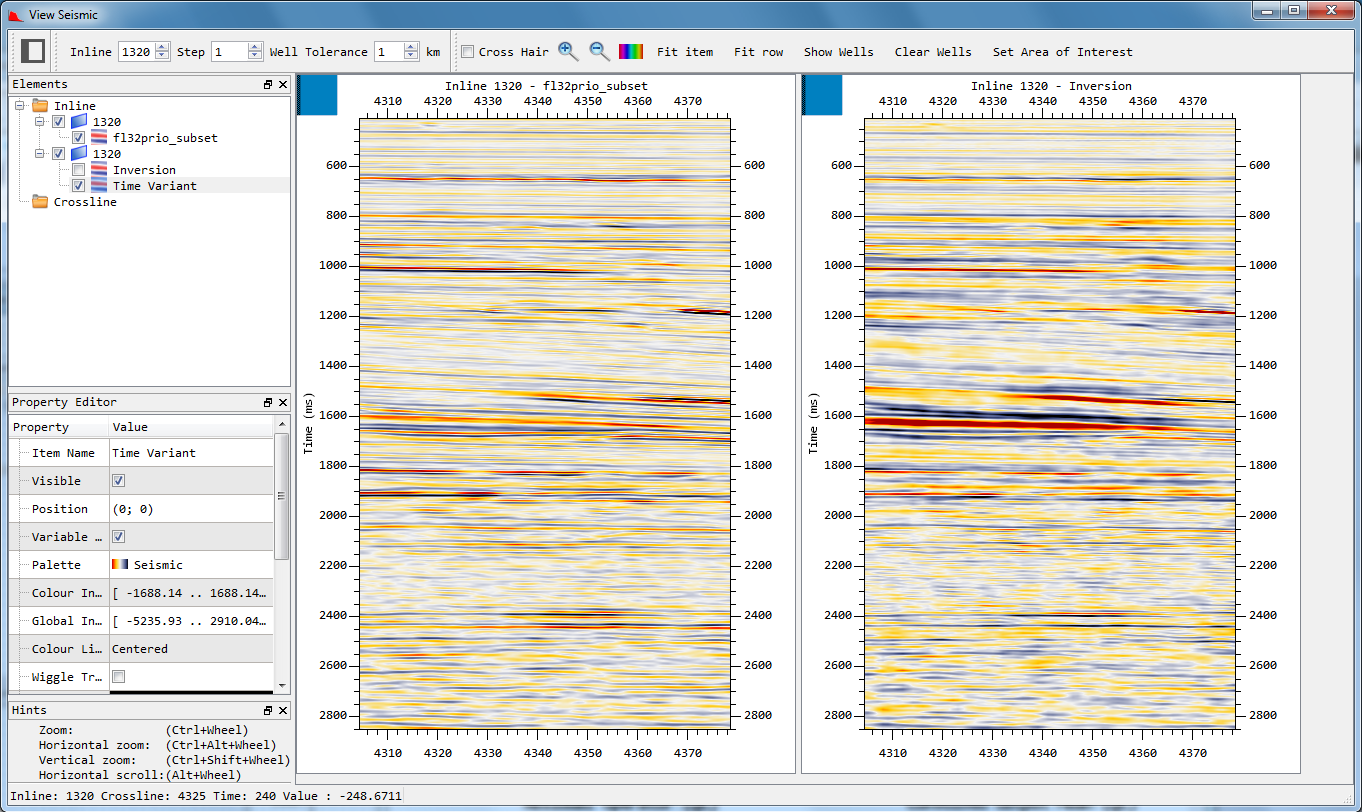
| TimeVariant Filtered Log | Operators selected from within the Time Variant dialog are convolved with input well logs and displayed. |
| Apply to All Wells | Apply Filtered log(Colour, line width, gain, polarity), Unfiltered log colour, display time start offset properties to all wells visible within GV. |
The seismic display area shows the seismic data that has been selected by the 'Elements' controller. This is a highly flexible and interactive viewing area allowing the user to focus attention on areas of particular interest within the seismic volume. The seismic display area can contain one or more seismic panels. Within an individual seismic panel, a number of operations are available to change the extent of displayed data:-
| Desired action | Description |
| Scaling: | Click on a panel to select, then with the 'Control' key pressed rotate the mouse wheel to zoom in/out on the selected seismic data. The data will zoom in/out around the current cursor location. |
| Horizontal scaling: | With the 'Control' and 'Alt' keys pressed, rotate the mouse wheel to zoom in/out on the selected seismic data in the horizontal direction. |
| Vertical scaling: | With the 'Control' and 'Shift' keys pressed, rotate the mouse wheel to zoom in/out on the selected seismic data in the vertical direction. |
| Moving data: | When the cursor is positioned over a seismic panel, press mouse button one. The cursor will change to a hand shape allowing data to be grabbed and moved. |
| Vertical scrolling: | When data in a seismic panel is zoomed in, the data can be scrolled vertically using the mouse wheel. |
| Horizontal scrolling: | When data in a seismic panel is zoomed in, the data can be scrolled horizontally. This is achieved by pressing the 'Alt' key and rotating the mouse wheel. |
| Change display data range: | At the top left corner of each seismic panel is a blue box. This shows the extent of the displayed seismic data compared to the extent of the available seismic data.Click mouse button 1 on the blue box. This will display a 'Select trace/z range for display' dialog allowing you to adjust the extents either by using the spin boxes for min/max traces and min/max time samples or by grabbing the edges or corners of the blue box and dragging. |
| Remove seismic panel: | With the mouse over a seismic panel, right click and select "Remove" on the pop-up menu item. This will immediately remove the panel and all volumes displayed within that seismic panel. |
| Add Well Logs | With the mouse over a seismic panel, right-click and select "Add Well Logs". Well-Logs selected within the pop-up will be displayed within the seismic panels. |