This section describes how you interface with the main window and its ancillary tools. The primary tools allowing you to load data, analyse, design and apply the Low End and High End operators are described in greater detail in later sections.
The application main window GUI consists of, from top to bottom, a menubar area, a toolbar area, a chart tabs area and a status area (see figure below). The chart tabs area which occupies the large central area of the main window is used to display various charts of spectra and time data providing instant feedback to the Interpretation Geoscientist in his/her quest to design both operators. The four sub-sections which follow will provide you with a description of each of these areas. We will pay particular attention to the central chart area.

This sub-section describes the actions performed by the various menu items.
| Creates a new Stack Ghost Suppression (SGS) session using the default SGS Session template (shortcut Ctrl+N). | |
| Creates a new SGS session a using a user saved template. By default, the software will look for templates stored in a special directory, created for this purpose, within the application installation tree. | |
| Opens a previously saved SGS session (shortcut Ctrl+O). This facility allows you to restore the SGS parameters together with the data from a previously saved session. Restoring a previously saved session can take a few moments while database access is established. Note, if the stored data within the database has been modified since the session save time, then it is possible that the operator, which are different to those available at the session save time, might be generated following a session restore. | |
| Saves a SGS session. This allows the SGS parameters, together with information about the data used, to be saved. In this way, data can be easily reloaded and the operator can be generated at some future date. If this is the first time that this is saved then the user will be presented with a file selector dialog for this purpose (shortcut Ctrl+S). | |
| Saves the current SGS session under a different name. A file selector dialog will pop-up for this purpose. See "Save" above for more details. | |
| Saves the current SGS session as a new template. By default, new templates will be saved in the site wide templates directory in the software installation tree. A standard File Selector will pop up to allow you to choose your output location. | |
| Saves the SGS operator set to the database. This menu item will pop up a Save Operator dialog. Enter a new operator name or leave blank for Petrel to create the name for you. | |
The Print option prints both the report and the charts to a specified printer. Alternatively, you can print to file. However, if this option is selected then there is a known bug which will cause the charts output to overwrite the report output. If you need to output both the report and the chart to a file, then use Print Report... and Print Charts... separately. The Print Report... option prints the report to a specified printer. Alternatively, you can print the report to a file. The Print Charts... option prints the charts to a specified printer. Alternatively, you can print the charts to a file. | |
The All Charts... option saves all charts in the central area to an image file. The following image formats are supported: PNG (default) and BMP. The Visible Charts... option saves charts that are currently visible in the central area. | |
The Import Chart Configuration... option pops up a file selector dialog which will allow you to select a previously saved session. The chart configuration of that session file is applied to your current session. Note the data and parameters stored in the session files are ignored. This provides you with a very powerful facility which allows you to view your current data using a variety of different chart configurations. The Export Operator... option allows you to export the operator to an ASCII file. The Export Data Item... option exports one or more of any of the currently displayed data items to an ASCII file. The Import Data Item... option allows you to import from an ASCII file previously exported data items. Only raw data items are imported with this facility. | |
| Pops up a dialog which displays various SGS parameters nicely formatted. | |
| Exits the application. |
| Pops up the "Tabs Controller Dialog" which will allow you to modify each charts tab configuration as well as chart parameters within the central area of the main window. | |
| Redraws all the charts within the current charts tab area. | |
| Provides a global zoom-in facility which makes the current charts tab area grow by a fixed amount each time this menu item is clicked. There is an upper maximum. | |
| Provides a global zoom-out facility which makes the current charts tab area shrink by a fixed amount each time this menu item is clicked. There is a lower minimum. | |
| Provides a seismic view facility that allows the rapid viewing of the input seismic volume. This enables the user to see the effect that the current operator will have in real time. |
| Pops up the "Select Input Data" dialog which allows you to select the seismic to use in the analysis and operator design. | |
| Pops up the "Deghosting Operator Operator" dialog which allows you to control standard parameters in the design of the Deghosting operator. |
| Pops up an HTML browser displaying the Quick Start document. | |
| Pops up an HTML browser displaying Contents page for software user guide. | |
| Pops up an HTML browser displaying Background and Theory to the software. | |
| Pops up the Application Disgnostics window that allows the level of detail and output destination of diagnostics to be set. If the application behaves in an unexpected way the Application Diagnostics captures the program activity which can help the ARK CLS support staff in determining what is happening. The application should be restarted, ideally from scratch, and the Application Diagnostics turned on before anything else is done. Then the application is run up to the point the problem occures. The diagnostics should then be emailed to support@arkcls.com. | |
| Pops up an HTML browser displaying the home page of ARK CLS Limited website. | |
| Opens a browser window where all our instructional videos are located. Alternately, in a browser window, navigate to www.arkcls.com/library/videos | |
| Pops up the About Seismic Broadband window. |
This sub-section describes the actions performed by the various toolbars and their icons. The toolbars can be positioned in various locations within the main window top (default beneath the menu bar), left, right and bottom (above status area). Additionally, the toolbars can be moved off the main window altogether and anchored on the desktop. To move the toolbar to a new location grab the handle at one end of the toolbar by pressing and holding mouse button 1 and dragging to the new location.
 | Creates a new Stack Ghost Suppression (SGS) session. |
 | Opens a previously saved SGS session. This facility allows you to restore the SGS parameters together with the data from a previously saved session. Restoring a previously saved session can take a few moments while database access is established. Note, if the stored data within the database has been modified since the session save time, then it is possible the operator, which are different to those available at the session save time, might be generated following a session restore. |
 | Saves a SGS session. This allows the SGS parameters, together with information about the data used, to be saved. In this way, data can be easily reloaded and the operator generated at some future date. If this is the first time that this is saved then the user will be presented with a file selector dialog for this purpose. |
 | Saves the SGS operator set to the Petrel. This menu item will pop up a Save Operator dialog. |
 | Print both the report and the charts to a specified printer. Alternatively, you can print to file. However, if this option is selected then there is a known bug which will cause the charts to overwrite the report. If you need to output both the report and the chart to a file then use menu File->Print->Print Report... and File->Print->Print Charts... separately. |
 | Displays parameter report. This icon pops up the "Parameter Report" dialog. |
 | Pops up the "Select Input Data" dialog which allows you to select the seismic to use in the analysis and operator design. |
 | Pops up the "Design Operator" dialog which allows you to control standard parameters in the design of the deghosting operator. |
 | Pops up the "Tabs Controller Dialog" which will allow you to modify each charts tab configuration as well as chart parameters within the central area of the main window. |
 | Redraws all the charts within the current charts tab area. |
 | Provides a global zoom-in facility which makes the current charts tab area grow by a fixed amount each time this menu item is clicked. There is an upper maximum. |
 | Provides a global zoom-out facility which makes the current charts tab area shrink by a fixed amount each time this menu item is clicked. There is a lower minimum. |
 | Provides a seismic view facility that allows the rapid viewing of the input seismic volume. This enables the user to see the effect that the current operator will have in real time. |
 | This icon pops up the online help system. |
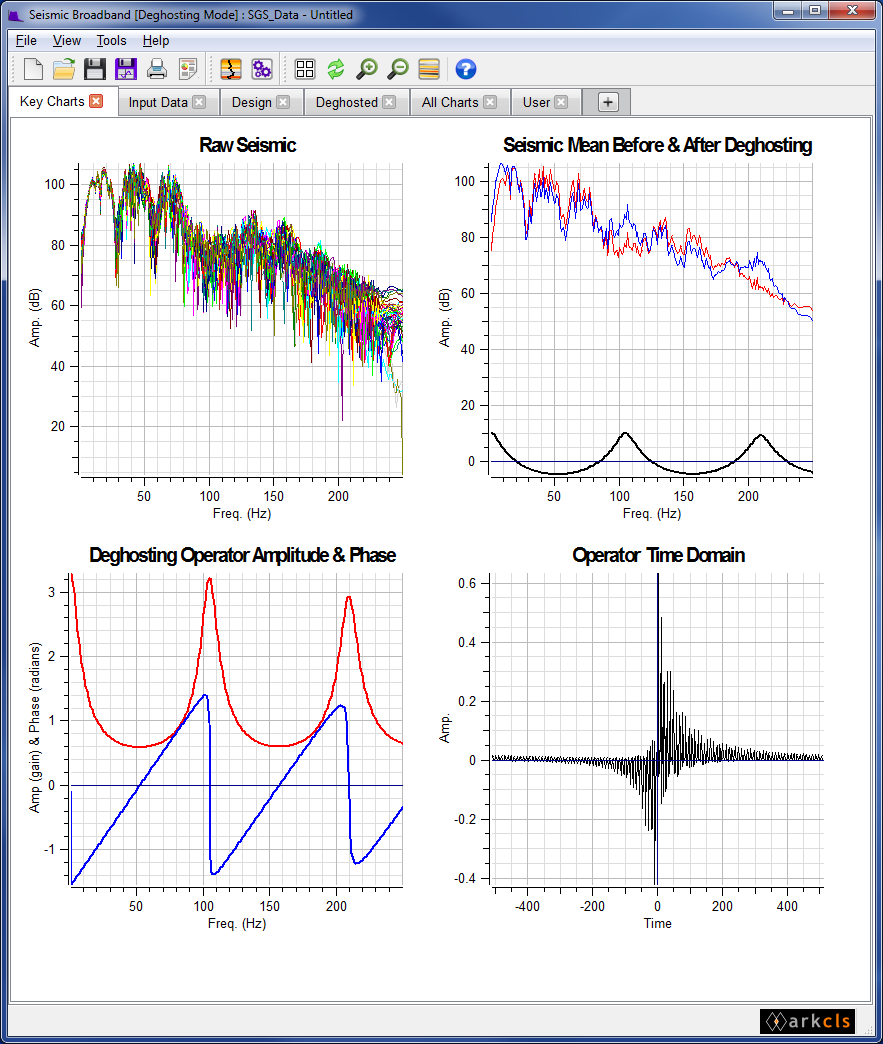
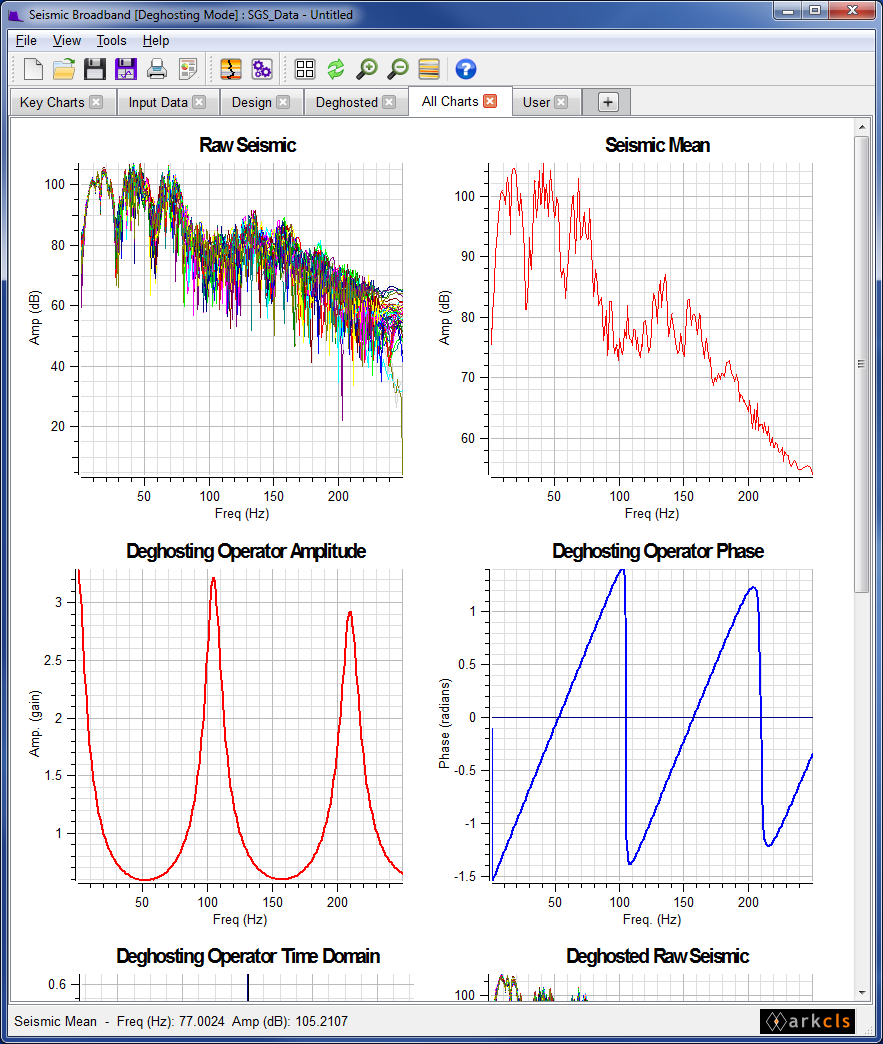
The figure above shows a typical Seismic Broadband main window with the Seismic charts tab selected. The following gives a brief description of each of the charts displayed on each tab using the supplied default template (moving left to right and top to bottom)
Raw Seismic
This chart displays the spectra for each of the set of seismic traces used for the analysis and design of the deghosting operator.
Seismic Mean Before and After Deghosting
This chart displays the mean spectrum of all the raw spectra before (red) and after (blue) the deghosting operator has been applied. The difference between the Before and After is displayed in black. This is essentially the deghosting operator in the frequency domain.
Deghosting Operator Amplitude and Phase
Displays the amplitude of the deghosting operator (red) in the frequency domain along with the phase angle of the operator (blue) in radians.
Operator Time Domain
Displays the deghosting operator in the time domain.
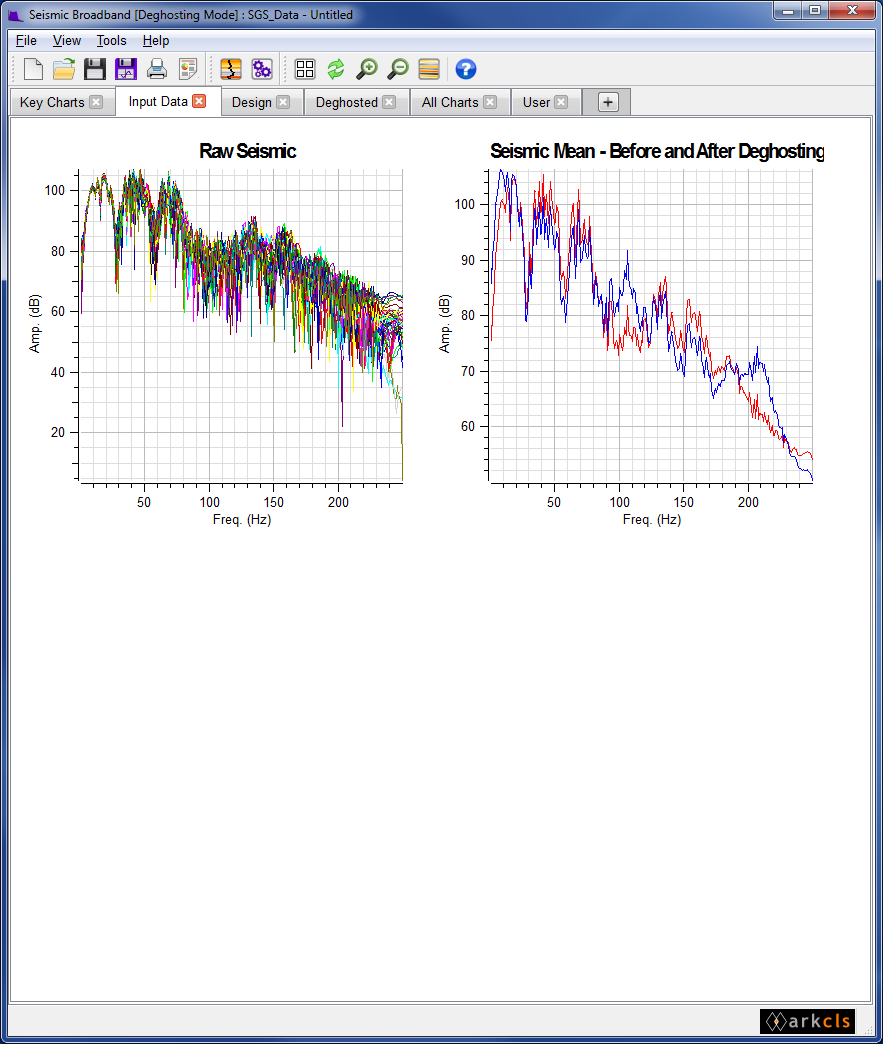
The figure above shows a typical Stack Ghost Suppression main window with the Input Data charts tab selected. The charts are from left to right and top to bottom:-
Raw Seismic
This chart displays the spectra for each of the set of seismic traces used for the analysis and design of the deghosting operator.
Seismic Mean Before and After Deghosting
The contents of this chart are described in the Key Charts section above.
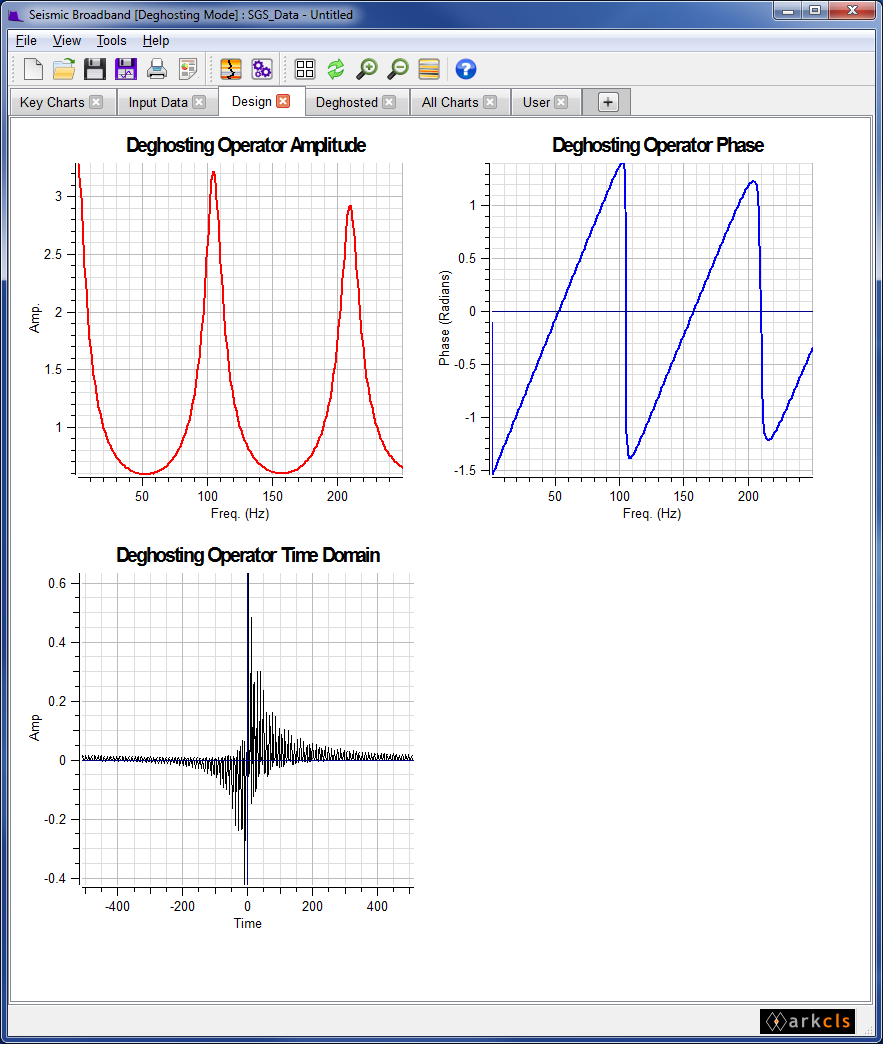
The figure above shows a typical SGS main window with the Design operator charts tab selected. The charts are from left to right and top to bottom:-
Deghosting Operator Amplitude
Displays the amplitude (gain) of the deghosting operator in the frequency domain.
Deghosting Operator Phase
Displays the phase in radians of the deghosting operator.
Deghosting Operator Time Domain
Displays the deghosting operator in the time domain.
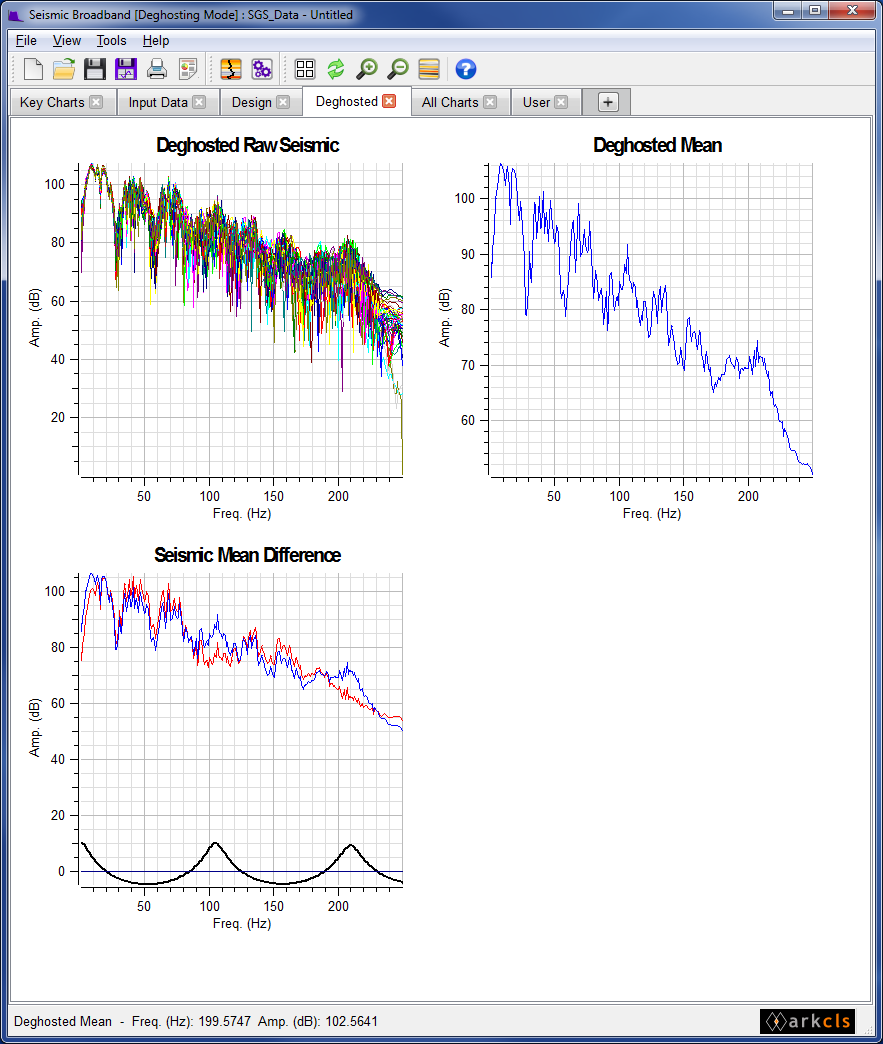
The figure above shows a typical SGS main window with the Deghosted charts tab selected. The charts are from left to right and top to bottom:-
Deghosted Raw Seismic
Displays the amplitude spectra (in dBs) for each of the set of seismic traces used for the analysis and design after the deghosting operator has been applied.
Deghosted Mean
Displays the mean spectrum of all the raw spectra after the deghosting operator has been applied.
Seismic Mean Difference
This chart displays the mean spectrum of all the raw spectra before (red) and after (blue) the deghosting operator has been applied The difference between the Before and After is displayed in black. This is essentially the deghosting operator in the frequency domain.
The figure above shows a SGS main window with the All Chart charts tab selected.
This tab contains all the charts discribed in the tabs above.
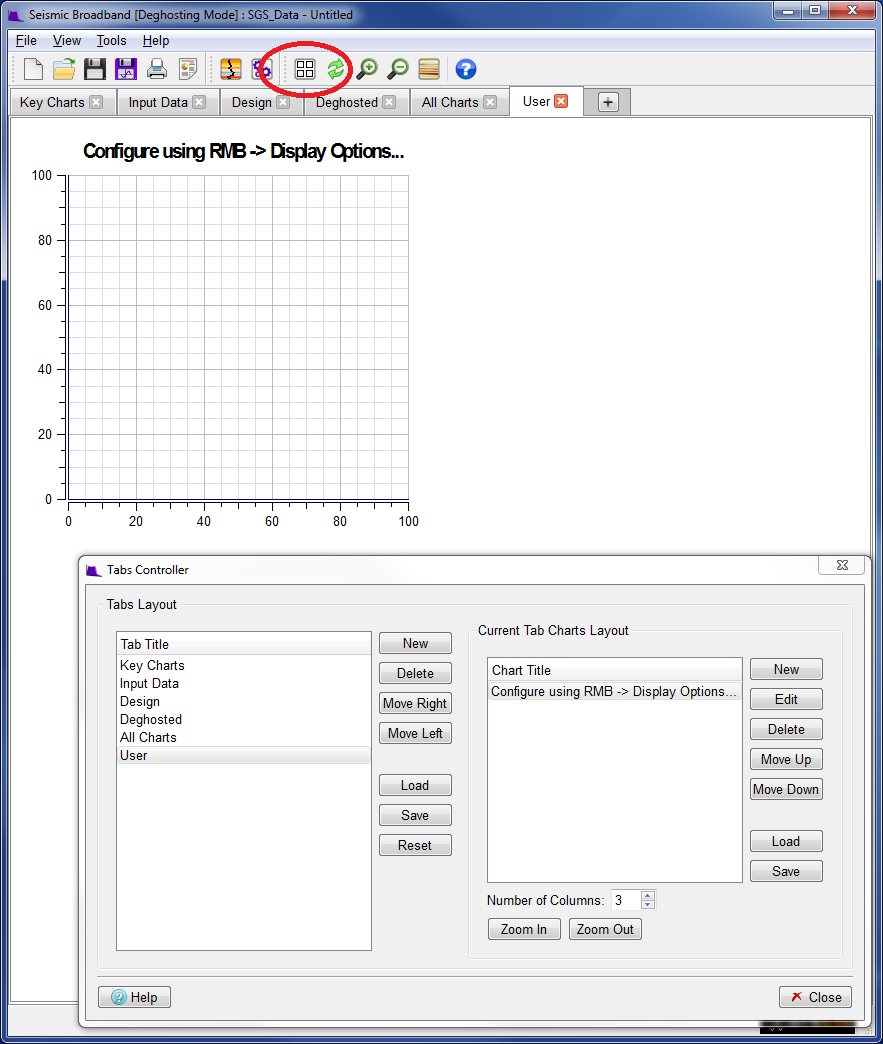
The figure above shows a SGS main window with the User Chart charts tab selected.
This is an emtpy chart that the user can configure him/herself. This is done by clicking the Tab Controller button icon (ringed in red in the figure above) then using the window to configure the chart.
The status area at the bottom of the main window is used to display various messages and other information for you. For example, if you pass the mouse over a toolbar icon then a tip is displayed in this area indicating what the purpose of the icon is. The status area is also used to display information about a given chart as the mouse passes over the central area of the main window.
There are various main window ancillary tools within the Stack Ghost Suppression application which you might find helpful and deserve a mention. These are Save Operator, Export Operator, Export Data Items, Import Data Items and Parameter Report.
Clicking the File->Save Operator... menu item in this mode will pop up the "Save Operator" dialog. If you haven't saved the operator during your session or if the operator have changed since you last saved it, then you will be prompted to save the operators before the program exits.
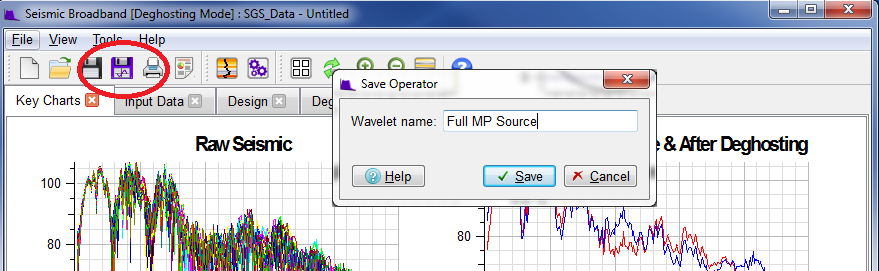
The figure above shows the "Save Operator" dialog. Enter a new name or leave blank to let Petrel to create a name for you.
The Import Chart Configuration tool allows you to import from a saved session the chart configuration defined within that session. This is a powerful facility allowing you to rapidly change your display layout using your current data items. Clicking the File->Import/Export...->Import Chart Configuration... menu item will pop up a file selector dialog. Here you can traverse the file system to import the chart configuration from a previously saved session file.
The Export Operator tool allows you to export an operator to an ASCII file. Clicking the File->Import/Export...->Export Operator... menu item will pop up a file selector dialog. Here you can traverse the file system to export the operator as ASCII files.
This is a powerful ancillary tool which allows you to export any of the loaded or generated data items (time or frequency domain curves) to an ASCII file. Clicking the File->Import/Export...->Export Data Items... menu item will pop up the "Export Data Item" dialog.
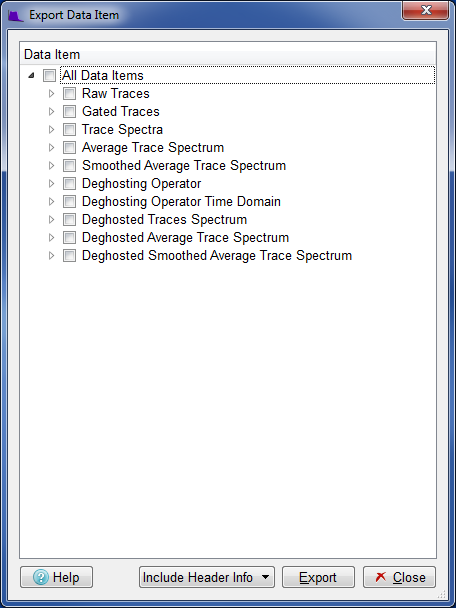
The figure above shows the "Export Data Item" dialog. This dialog contains a list view widget which allows you to export, to an ASCII file, either all the data items for every group, all the data items for a single group or a single data item from a group. This is achieved as follows:
By clicking the "All Data Items" on the "Export Data Item" dialog will select every data item currently available. Then, by clicking the Export push button you will be given a file selector dialog allowing you to save all these data items into a single ASCII file.
By clicking one of the groups beneath the "All Data Items" will select that group. Then, by clicking the Export push button you will again be given a file selector dialog allowing you to save the group data into a single ASCII file.
By clicking a data item within a group will select that data item. Then, by clicking the Export push button you will once again be given a file selector dialog allowing you to save the data item to a single ASCII file.
You can optionally output a header. This is useful if you are outputting two or more data items. It is recommended that you save the session immediately after doing export data items.
This ancillary tool which allows you to import from an ASCII file previously exported data items (see Export Data Item). The only items that are importabled are the raw data items ("Raw Traces") and the "Average Trace Spectrum". All other data items are ignored. By importing the mentioned data items, all derived data items can then be calculated in the normal manner. This tool is particularly useful if a colleague is having problems with software and/or data and has asked you to help but you don't have access to the database where the original seismic trace data and well impedance data is located. By asking your colleague to export "All Data Items" along with the session file and sending both to you then this might be of help in resolving the problem. Clicking the File->Import/Export...->Import Data Items... menu item will pop up a file selector dialog. This file selector will allow you to traverse the file system to open data items file. After selecting this file you will be prompted to open a session file. Choosing whether to open a session file is optional.
This ancillary tool allows you to display and optionally save the SGS parameters in a nicely formated manner. Clicking the File->Parameter Report... menu item will pop up the "Parameter Report" dialog.
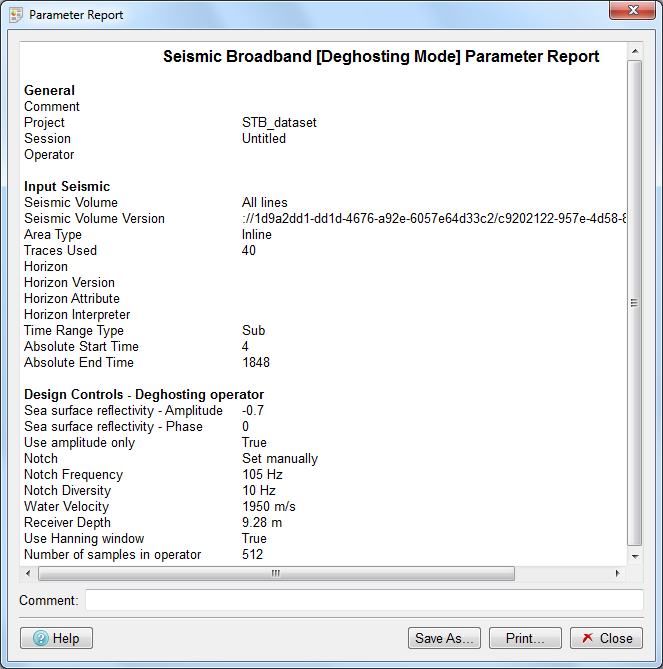
The figure above shows the "Parameter Report" dialog. This dialog displays the key parameters in the SGS analysis and design phase nicely formated. Click the Save As... push button will pop up a file selector dialog allowing you to save to an ASCII file the formated parameter report.